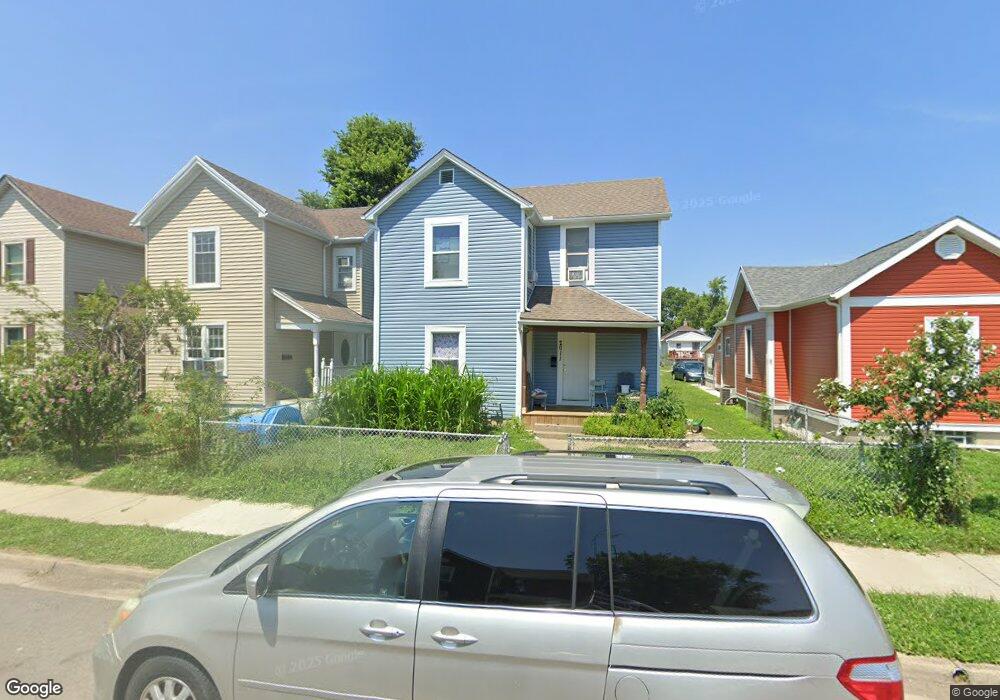
2011 Stegman Ave Dayton, OH 45404
Old North Dayton NeighborhoodEstimated Value: $62,000 - $123,000
3
Beds
2
Baths
1,216
Sq Ft
$78/Sq Ft
Est. Value
About This Home
This home is located at 2011 Stegman Ave, Dayton, OH 45404 and is currently estimated at $94,961, approximately $78 per square foot. 2011 Stegman Ave is a home located in Montgomery County with nearby schools including Kiser Elementary, Ruskin Elementary School, and Pathway School of Discovery.
Ownership History
Date
Name
Owned For
Owner Type
Purchase Details
Closed on
Aug 26, 2022
Sold by
Jenny-Ohio-1 Llc
Bought by
Flores Nau and Nunez Lucia
Current Estimated Value
Purchase Details
Closed on
Mar 21, 2017
Sold by
Jlh In Fw F1 01 Llc
Bought by
Jenny Ohio 1 Llc
Purchase Details
Closed on
Jul 25, 2013
Sold by
Fannie Mae
Bought by
Jhl In Fw F1 01 Llc
Purchase Details
Closed on
Jun 6, 2013
Sold by
Brack George and Liberty Savings Bank Fsb
Bought by
Federal National Mortgage Association
Purchase Details
Closed on
May 14, 2013
Sold by
Brack George and Liberty Savings Bank Fsb
Bought by
Federal National Mortgage Association
Purchase Details
Closed on
Mar 6, 2001
Sold by
Jaynes James D
Bought by
Countrywide Home Loans Inc
Purchase Details
Closed on
Feb 26, 2001
Sold by
Jaynes James D
Bought by
Countrywide Home Loans Inc
Purchase Details
Closed on
Dec 2, 1997
Sold by
Tavener Virgie
Bought by
Jaynes James D
Create a Home Valuation Report for This Property
The Home Valuation Report is an in-depth analysis detailing your home's value as well as a comparison with similar homes in the area
Home Values in the Area
Average Home Value in this Area
Purchase History
| Date | Buyer | Sale Price | Title Company |
|---|---|---|---|
| Flores Nau | $25,000 | None Listed On Document | |
| Jenny Ohio 1 Llc | $38,000 | Metropolitan Title Of Indian | |
| Jhl In Fw F1 01 Llc | $12,500 | Buckeye Title | |
| Federal National Mortgage Association | $14,000 | None Available | |
| Federal National Mortgage Association | $14,000 | None Available | |
| Countrywide Home Loans Inc | $30,000 | -- | |
| Countrywide Home Loans Inc | $30,000 | -- | |
| Jaynes James D | $41,000 | -- |
Source: Public Records
Tax History Compared to Growth
Tax History
| Year | Tax Paid | Tax Assessment Tax Assessment Total Assessment is a certain percentage of the fair market value that is determined by local assessors to be the total taxable value of land and additions on the property. | Land | Improvement |
|---|---|---|---|---|
| 2024 | $527 | $7,510 | $2,690 | $4,820 |
| 2023 | $527 | $7,510 | $2,690 | $4,820 |
| 2022 | $543 | $6,410 | $2,300 | $4,110 |
| 2021 | $493 | $6,410 | $2,300 | $4,110 |
| 2020 | $470 | $6,410 | $2,300 | $4,110 |
| 2019 | $424 | $5,090 | $1,940 | $3,150 |
| 2018 | $446 | $5,090 | $1,940 | $3,150 |
| 2017 | $443 | $5,090 | $1,940 | $3,150 |
| 2016 | $440 | $4,800 | $1,840 | $2,960 |
| 2015 | $418 | $4,800 | $1,840 | $2,960 |
| 2014 | $418 | $4,800 | $1,840 | $2,960 |
| 2012 | -- | $11,940 | $4,200 | $7,740 |
Source: Public Records
Map
Nearby Homes
- 2048 Stegman Ave
- 2119 Bellefontaine Ave
- 1083 Valley St
- 544 Brandt St
- 304 Alaska St
- 175 Rita St
- 1304 Valley St
- 240 Alaska St
- 129 Rita St
- 233 Alton Ave
- 1815 Warner Ave
- 188 Alton Ave
- 329 Grove Ave
- 111 Alaska St
- 260 Grove Ave
- 1020 Saint Adelbert Ave
- 159 Alton Ave Unit 157
- 70 Baltimore St
- 96 Notre Dame Ave
- 144 Alton Ave
- 2007 Stegman Ave
- 2015 Stegman Ave
- 2005 Stegman Ave
- 2019 Stegman Ave
- 2001 Stegman Ave
- 2023 Stegman Ave
- 2026 Bellefontaine Ave
- 2022 Bellefontaine Ave
- 2030 Bellefontaine Ave
- 2036 Bellefontaine Ave
- 255 Ritchie St
- 2008 Stegman Ave
- 2027 Stegman Ave
- 2012 Stegman Ave
- 2016 Stegman Ave
- 2040 Bellefontaine Ave
- 2044 Bellefontaine Ave
- 2031 Stegman Ave
- 2048 Bellefontaine Ave
- 2020 Stegman Ave