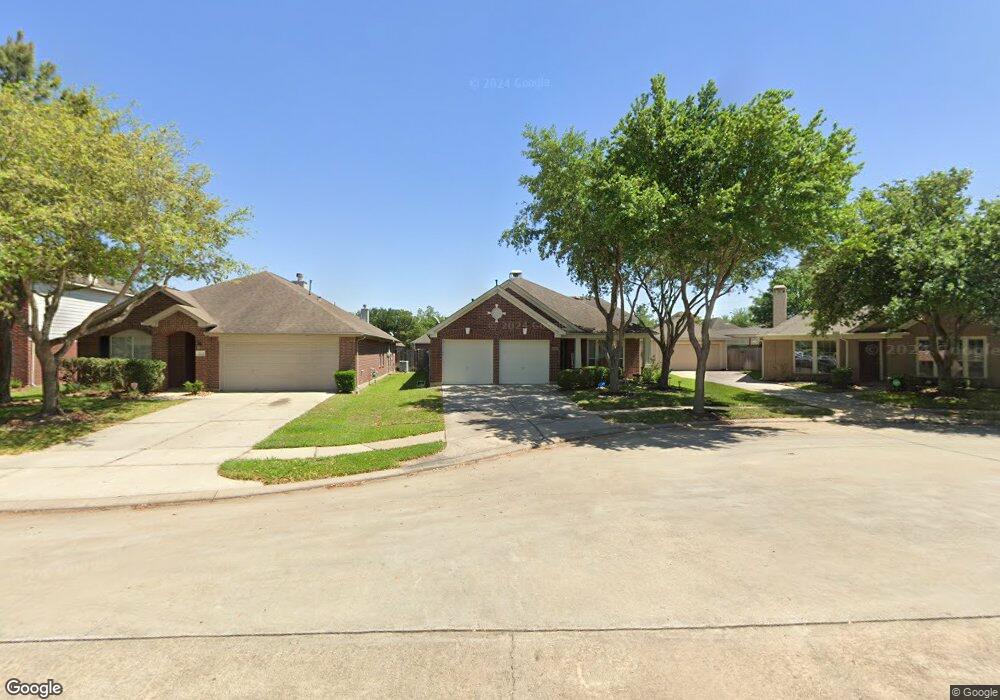
20110 E Lakebridge Ln Richmond, TX 77407
Lakemont NeighborhoodEstimated Value: $317,000 - $335,561
4
Beds
2
Baths
2,055
Sq Ft
$158/Sq Ft
Est. Value
About This Home
This home is located at 20110 E Lakebridge Ln, Richmond, TX 77407 and is currently estimated at $325,140, approximately $158 per square foot. 20110 E Lakebridge Ln is a home located in Fort Bend County with nearby schools including H.F. McNeill Elementary School, Henry Wertheimer Middle School, and Briscoe Junior High School.
Ownership History
Date
Name
Owned For
Owner Type
Purchase Details
Closed on
Sep 21, 2017
Sold by
Cruz William and Cruz Gabrila Maria
Bought by
Melendez Carlos and Bonilla Gloria Yasmin
Current Estimated Value
Home Financials for this Owner
Home Financials are based on the most recent Mortgage that was taken out on this home.
Original Mortgage
$206,196
Outstanding Balance
$174,317
Interest Rate
4.37%
Mortgage Type
FHA
Estimated Equity
$150,823
Purchase Details
Closed on
Mar 31, 2006
Sold by
Perry Homes
Bought by
Cruz William and Cruz Maria Gabriela
Home Financials for this Owner
Home Financials are based on the most recent Mortgage that was taken out on this home.
Original Mortgage
$118,955
Interest Rate
6.21%
Mortgage Type
Fannie Mae Freddie Mac
Purchase Details
Closed on
Nov 10, 2005
Sold by
Ann Arundel Farms Ltd
Bought by
Cruz William and Maria Gabriela
Create a Home Valuation Report for This Property
The Home Valuation Report is an in-depth analysis detailing your home's value as well as a comparison with similar homes in the area
Home Values in the Area
Average Home Value in this Area
Purchase History
| Date | Buyer | Sale Price | Title Company |
|---|---|---|---|
| Melendez Carlos | -- | Texas American Title C | |
| Cruz William | -- | Chicago Title | |
| Cruz William | -- | -- |
Source: Public Records
Mortgage History
| Date | Status | Borrower | Loan Amount |
|---|---|---|---|
| Open | Melendez Carlos | $206,196 | |
| Previous Owner | Cruz William | $118,955 |
Source: Public Records
Tax History Compared to Growth
Tax History
| Year | Tax Paid | Tax Assessment Tax Assessment Total Assessment is a certain percentage of the fair market value that is determined by local assessors to be the total taxable value of land and additions on the property. | Land | Improvement |
|---|---|---|---|---|
| 2025 | $6,252 | $326,946 | $46,410 | $283,211 |
| 2024 | $6,252 | $297,224 | $8,111 | $289,113 |
| 2023 | $5,789 | $270,204 | $0 | $293,718 |
| 2022 | $6,246 | $245,640 | $0 | $259,330 |
| 2021 | $6,535 | $223,310 | $35,700 | $187,610 |
| 2020 | $6,502 | $219,500 | $35,700 | $183,800 |
| 2019 | $6,275 | $203,270 | $35,700 | $167,570 |
| 2018 | $6,421 | $206,490 | $35,700 | $170,790 |
| 2017 | $6,263 | $200,340 | $35,700 | $164,640 |
| 2016 | $6,016 | $192,430 | $35,700 | $156,730 |
| 2015 | $2,876 | $174,940 | $35,700 | $139,240 |
| 2014 | $2,744 | $159,040 | $35,700 | $123,340 |
Source: Public Records
Map
Nearby Homes
- 19914 Shore Meadows Ln
- 20310 Port Bishop Ln
- 7135 Rambling Tree Ln
- 20506 Newfalls Ct
- 20506 Port Bishop Ln
- 20507 Somerset Hill Ct
- 17518 Zinnia Dawn Dr
- 7031 Kendall Lake Ct
- 19715 Heron Shadow Ct
- 20618 Rustic Hearth Ct
- 7410 Rain Drop Ct
- 19807 Coreybend Ct
- 7503 Amber Village Cir
- 7423 Garland Mist Ln
- 19731 Mission Pines Ln
- 19843 Quarry Stone Ln
- 19810 Quarry Stone Ln
- 7827 Sydney Bay Ct
- 19707 Mission Pines Ln
- 7814 Chinaberry Sky Ln
- 20114 E Lakebridge Ln
- 20106 E Lakebridge Ln
- 20118 E Lakebridge Ln
- 19923 Shore Meadows Ln
- 19919 Shore Meadows Ln
- 19927 Shore Meadows Ln
- 19927 Shore Meadows Ln
- 20102 E Lakebridge Ln
- 19915 Shore Meadows Ln
- 20003 Shore Meadows Ln
- 20122 E Lakebridge Ln
- 19911 Shore Meadows Ln
- 19911 Shore Meadows Ln
- 20103 E Lakebridge Ln
- 20007 Shore Meadows Ln
- 20115 E Lakebridge Ln
- 20111 E Lakebridge Ln
- 20119 E Lakebridge Ln
- 20126 E Lakebridge Ln
- 20114 Broad Run Ln