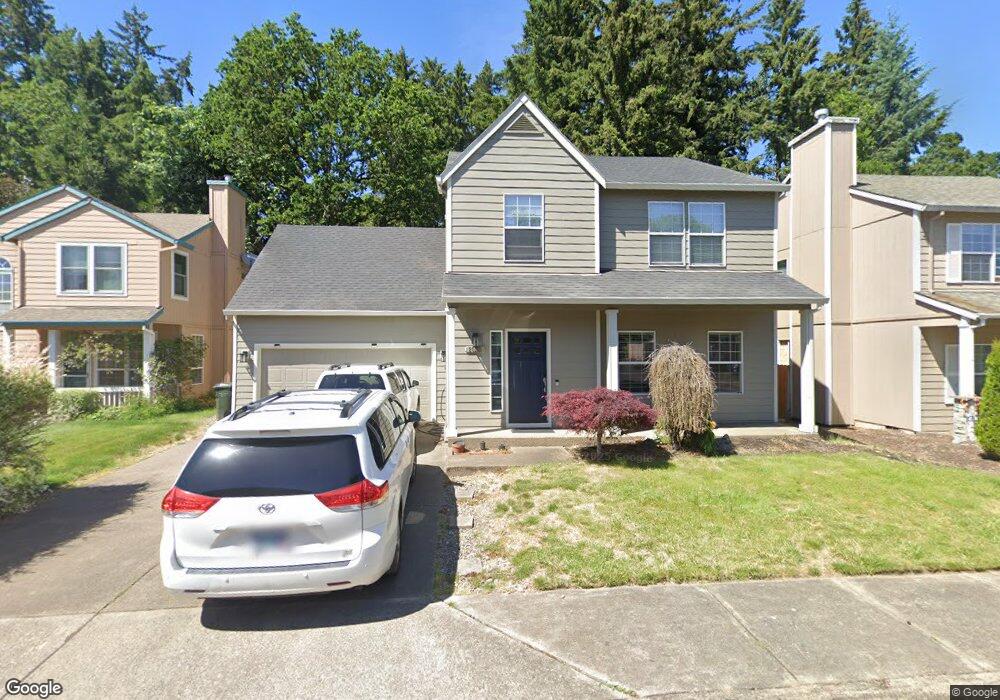
20113 SW Mario Ct Beaverton, OR 97007
Estimated Value: $478,000 - $560,000
4
Beds
3
Baths
2,088
Sq Ft
$253/Sq Ft
Est. Value
About This Home
This home is located at 20113 SW Mario Ct, Beaverton, OR 97007 and is currently estimated at $527,483, approximately $252 per square foot. 20113 SW Mario Ct is a home located in Washington County with nearby schools including Butternut Creek Elementary School, R.A. Brown Middle School, and Century High School.
Ownership History
Date
Name
Owned For
Owner Type
Purchase Details
Closed on
Dec 30, 2013
Sold by
Tran Thong V
Bought by
Thong Nguyen Minh T and Thong Van Tran
Current Estimated Value
Home Financials for this Owner
Home Financials are based on the most recent Mortgage that was taken out on this home.
Original Mortgage
$122,000
Outstanding Balance
$89,221
Interest Rate
3.75%
Mortgage Type
Adjustable Rate Mortgage/ARM
Estimated Equity
$438,262
Purchase Details
Closed on
Aug 31, 2004
Sold by
Chapin James J
Bought by
Tran Thong V
Home Financials for this Owner
Home Financials are based on the most recent Mortgage that was taken out on this home.
Original Mortgage
$166,400
Interest Rate
6.06%
Mortgage Type
Unknown
Purchase Details
Closed on
Mar 29, 1999
Sold by
Jil Development Inc
Bought by
Chapin James J
Home Financials for this Owner
Home Financials are based on the most recent Mortgage that was taken out on this home.
Original Mortgage
$158,400
Interest Rate
9.75%
Create a Home Valuation Report for This Property
The Home Valuation Report is an in-depth analysis detailing your home's value as well as a comparison with similar homes in the area
Home Values in the Area
Average Home Value in this Area
Purchase History
| Date | Buyer | Sale Price | Title Company |
|---|---|---|---|
| Thong Nguyen Minh T | $190,000 | Fidelity Natl Title Co Of Or | |
| Tran Thong V | $208,000 | Chicago Title Insurance Co | |
| Chapin James J | $176,000 | First American Title Ins Co |
Source: Public Records
Mortgage History
| Date | Status | Borrower | Loan Amount |
|---|---|---|---|
| Open | Thong Nguyen Minh T | $122,000 | |
| Previous Owner | Tran Thong V | $166,400 | |
| Previous Owner | Chapin James J | $158,400 | |
| Closed | Chapin James J | $8,800 |
Source: Public Records
Tax History Compared to Growth
Tax History
| Year | Tax Paid | Tax Assessment Tax Assessment Total Assessment is a certain percentage of the fair market value that is determined by local assessors to be the total taxable value of land and additions on the property. | Land | Improvement |
|---|---|---|---|---|
| 2026 | $4,503 | $311,590 | -- | -- |
| 2025 | $4,503 | $302,520 | -- | -- |
| 2024 | $4,376 | $293,710 | -- | -- |
| 2023 | $4,376 | $285,160 | $0 | $0 |
| 2022 | $4,210 | $285,160 | $0 | $0 |
| 2021 | $4,139 | $268,800 | $0 | $0 |
| 2020 | $4,052 | $260,980 | $0 | $0 |
| 2019 | $3,928 | $253,380 | $0 | $0 |
| 2018 | $3,757 | $246,000 | $0 | $0 |
| 2017 | $3,616 | $238,840 | $0 | $0 |
| 2016 | $3,522 | $231,890 | $0 | $0 |
| 2015 | $3,382 | $225,140 | $0 | $0 |
| 2014 | $3,322 | $218,590 | $0 | $0 |
Source: Public Records
Map
Nearby Homes
- 4895 SW 202nd Ave
- 20020 SW Walquin Ct
- 19753 SW Celebrity St
- 19901 SW Meadowbrook Ct
- 4650 SW Southview Terrace
- 4658 SW Stoddard Dr
- 19735 SW Rosa Rd
- 19560 SW Madeline St
- 20675 SW Rosa Dr
- 5820 SW 206th Ave
- 6050 SW Cross Creek Dr
- Morgan Plan at Butternut Creek - The Ember Collection
- 20478 SW Ravenswood St
- 20591 SW Ravenswood St
- 6105 SW Zabaco Terrace
- 20385 SW Shelley Ct
- 19778 SW Prospect Ln
- 19055 SW Butternut St
- 5826 SW Grayson Terrace
- 6436 SW Fountain Grove Terrace
- 20095 SW Kost Ln
- 20129 SW Mario Ct
- 5209 SW 201st Ave
- 20079 SW Kost Ln Unit LN
- 20079 SW Kost Ln
- 20140 SW Jaylee St
- 20147 SW Mario Ct
- 20170 SW Jaylee St
- 20142 SW Mario Ct
- 5204 SW 201st Ave
- 20061 SW Kost Ln
- 20101 SW Celebrity St
- 20133 SW Celebrity St
- 20097 SW Celebrity St
- 20050 SW Jaylee St
- 20230 SW Jaylee St
- 20151 SW Celebrity St
- 20073 SW Celebrity St
- 20191 SW Mario Ct
- 20160 SW Mario Ct