A
Seller's Agent in 2025
Ara Poteete
Coldwell Banker Select
(918) 458-5888
1 in this area
31 Total Sales

Estimated Value: $786,000 - $1,337,000
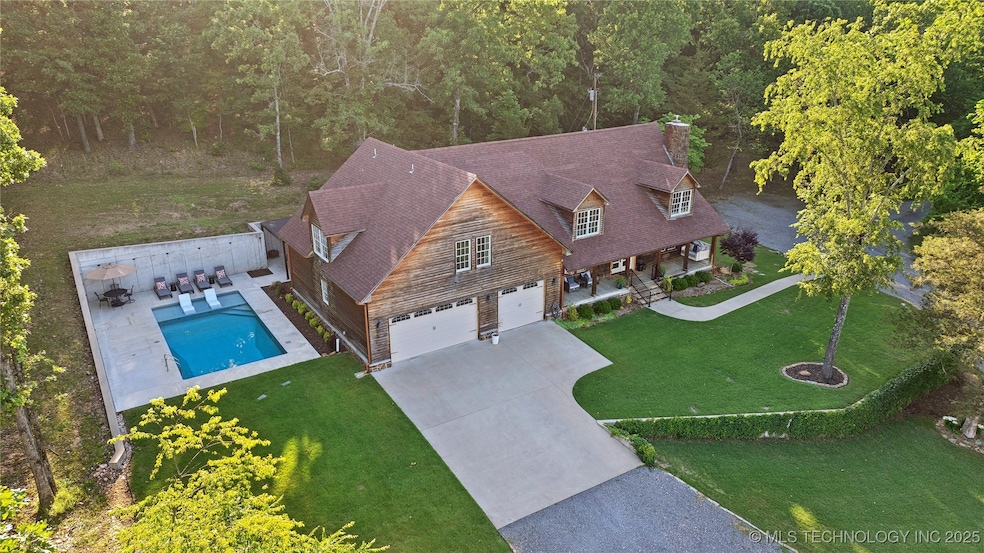
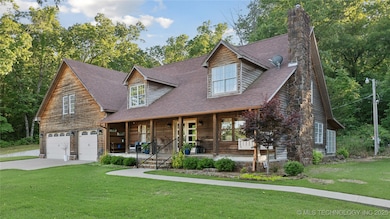
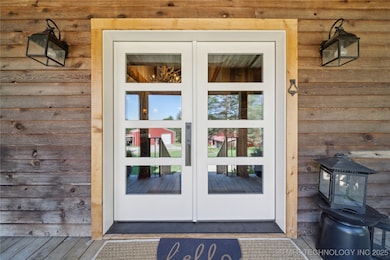
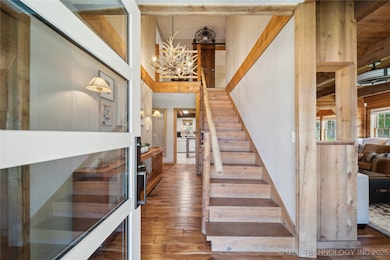
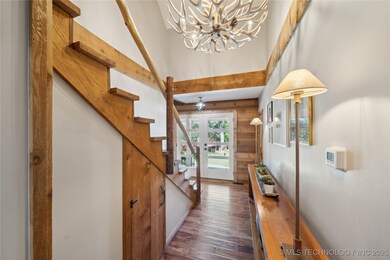
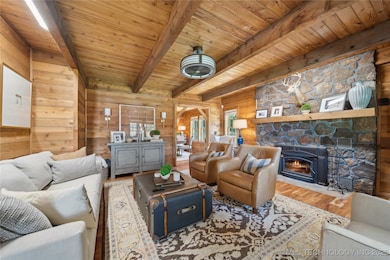
20 acres. Two living structures. One private paradise! Tucked behind a gated entry just minutes away from town, this estate offers a unique blend of luxury and serene natural beauty. The main residence spans 3778 m/l sq ft (courthouse) showcasing refined craftsmanship, spacious living areas & bedrooms with designer finishes throughout. Custom woodwork and artisan finishes coupled with contemporary upgrades; this home has an unrivaled mixture of rustic charm and modern elegance. A Spa-inspired primary suite/bathroom, closed concept living floorplan, with oversized windows bringing in the outdoors but still maintaining a homey-like feel. Additionally, the property offers a 3200 sq ft (courthouse) 2 bed, 2 bath barn dominium that sleeps 18 comfortably, equipped with two generous living areas, an entertainment room, and a full kitchen. It's versatile, flexible, and an exceptional spot for guests, a home-based business, income producing Airbnb, a multigenerational family, event venue, creative workspace, or an exclusive retreat space on its own. The property also accommodates outdoor enthusiasts with a resort style pool, 1-acre aerated and stocked pond, and a 60x60 shop surrounded by heavily wooded acreage, offering natural peace and privacy.
Last Agent to Sell the Property
Coldwell Banker Select License #181284 Listed on: 06/03/2025

We collect this data history from publicly available records. To have your information removed, we recommend requesting removal directly through your county’s website.
We collect this data history from publicly available records. To have your information removed, we recommend requesting removal directly through your county’s website.
| Date | Buyer | Sale Price | Title Company |
|---|---|---|---|
| $1,200,000 | Old Republic National Title | ||
| -- | None Available | ||
| $132,000 | Capital Abstract & Title | ||
| -- | -- | ||
| -- | -- |
We collect this data history from publicly available records. To have your information removed, we recommend requesting removal directly through your county’s website.
| Date | Status | Borrower | Loan Amount |
|---|---|---|---|
| Open | $703,000 | ||
| Previous Owner | $100,000 |
We collect this data history from publicly available records. To have your information removed, we recommend requesting removal directly through your county’s website.
| Date | Event | Price | List to Sale | Price per Sq Ft |
|---|---|---|---|---|
| 10/14/2025 10/14/25 | Sold | $1,200,000 | -4.0% | $318 / Sq Ft |
| 06/03/2025 06/03/25 | For Sale | $1,250,000 | -- | $331 / Sq Ft |
We collect this data history from publicly available records. To have your information removed, we recommend requesting removal directly through your county’s website.
| Year | Tax Paid | Tax Assessment Tax Assessment Total Assessment is a certain percentage of the fair market value that is determined by local assessors to be the total taxable value of land and additions on the property. | Land | Improvement |
|---|---|---|---|---|
| 2025 | $2,629 | $28,154 | $7,563 | $20,591 |
| 2024 | $2,541 | $26,814 | $7,203 | $19,611 |
| 2023 | $2,541 | $25,537 | $5,992 | $19,545 |
| 2022 | $2,257 | $24,321 | $5,439 | $18,882 |
| 2021 | $2,157 | $23,163 | $4,912 | $18,251 |
| 2020 | $2,091 | $22,061 | $4,410 | $17,651 |
| 2019 | $826 | $8,789 | $2,899 | $5,890 |
| 2018 | $753 | $7,923 | $2,313 | $5,610 |
| 2017 | $716 | $7,546 | $2,203 | $5,343 |
| 2016 | $686 | $7,186 | $2,098 | $5,088 |
| 2015 | $614 | $6,844 | $2,105 | $4,739 |
| 2014 | $614 | $6,519 | $2,005 | $4,514 |
A
Seller's Agent in 2025
Ara Poteete
Coldwell Banker Select
(918) 458-5888
1 in this area
31 Total Sales
Buyer's Agent in 2025
Tina Parker
Twin Oaks Realty, Inc.
(479) 633-9046
1 in this area
63 Total Sales
Source: MLS Technology
MLS Number: 2523758
APN: 0000-14-16N-22E-0-007-00
Disclaimer: Certain information contained herein is derived from information provided by parties other than Homes.com. All information provided is deemed reliable, but is not guaranteed to be accurate and should be independently verified.
![]() IDX information is provided exclusively for personal, non-commercial use, and may not be used for any purpose other than to identify prospective properties consumers may be interested in purchasing.
IDX information is provided exclusively for personal, non-commercial use, and may not be used for any purpose other than to identify prospective properties consumers may be interested in purchasing.
Information is deemed reliable but not guaranteed.
Ask me questions while you tour the home.