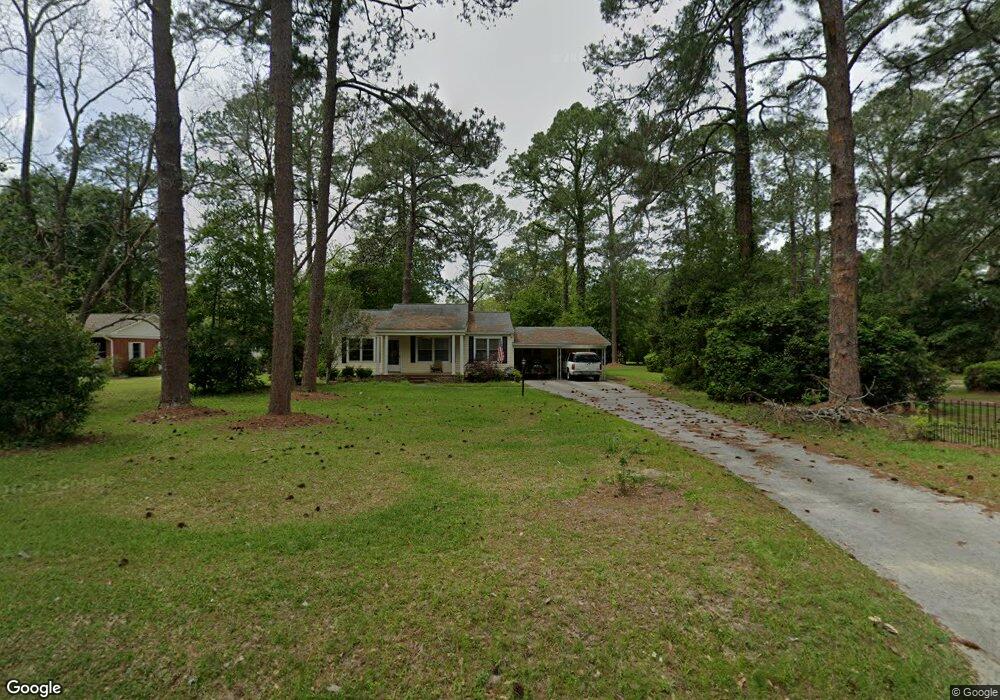
2012 3rd St SE Moultrie, GA 31768
Estimated Value: $216,660 - $265,000
3
Beds
3
Baths
1,993
Sq Ft
$121/Sq Ft
Est. Value
About This Home
This home is located at 2012 3rd St SE, Moultrie, GA 31768 and is currently estimated at $241,415, approximately $121 per square foot. 2012 3rd St SE is a home located in Colquitt County with nearby schools including Wright Elementary School, Willie J. Williams Middle School, and C.A. Gray Junior High School.
Ownership History
Date
Name
Owned For
Owner Type
Purchase Details
Closed on
Jan 23, 2020
Sold by
Hemingway & Associates Llc
Bought by
Pierce David Frank
Current Estimated Value
Home Financials for this Owner
Home Financials are based on the most recent Mortgage that was taken out on this home.
Original Mortgage
$161,515
Outstanding Balance
$141,878
Interest Rate
3.74%
Mortgage Type
New Conventional
Estimated Equity
$99,537
Purchase Details
Closed on
Dec 27, 2018
Sold by
Hemingway Nancy Marlene
Bought by
Hemingway & Associates Llc
Purchase Details
Closed on
Apr 26, 2018
Sold by
Nationstar Mtg Llc
Bought by
Hemingway Nancy Marlene
Purchase Details
Closed on
Feb 6, 2018
Sold by
Mcdaniel Jonathan R
Bought by
Nationstar Mtg Llc
Purchase Details
Closed on
Apr 9, 2004
Sold by
Faircloth James Raiford
Bought by
Mcdaniel Jonathan R
Purchase Details
Closed on
May 5, 1992
Bought by
Faircloth Elizabeth E
Create a Home Valuation Report for This Property
The Home Valuation Report is an in-depth analysis detailing your home's value as well as a comparison with similar homes in the area
Purchase History
| Date | Buyer | Sale Price | Title Company |
|---|---|---|---|
| Pierce David Frank | $159,900 | -- | |
| Hemingway & Associates Llc | -- | -- | |
| Hemingway Nancy Marlene | $57,500 | -- | |
| Nationstar Mtg Llc | $62,370 | -- | |
| Mcdaniel Jonathan R | $84,300 | -- | |
| Faircloth Elizabeth E | -- | -- |
Source: Public Records
Mortgage History
| Date | Status | Borrower | Loan Amount |
|---|---|---|---|
| Open | Pierce David Frank | $161,515 |
Source: Public Records
Tax History
| Year | Tax Paid | Tax Assessment Tax Assessment Total Assessment is a certain percentage of the fair market value that is determined by local assessors to be the total taxable value of land and additions on the property. | Land | Improvement |
|---|---|---|---|---|
| 2025 | $2,595 | $90,138 | $3,000 | $87,138 |
| 2024 | $2,595 | $80,566 | $3,000 | $77,566 |
| 2023 | $2,432 | $77,998 | $3,000 | $74,998 |
| 2022 | $2,535 | $75,730 | $3,000 | $72,730 |
| 2021 | $2,169 | $67,630 | $3,000 | $64,630 |
| 2020 | $1,326 | $38,441 | $3,000 | $35,441 |
| 2019 | $893 | $35,888 | $3,000 | $32,888 |
| 2018 | $1,390 | $34,802 | $3,000 | $31,802 |
| 2017 | $1,336 | $34,802 | $3,000 | $31,802 |
| 2016 | $1,390 | $34,802 | $3,000 | $31,802 |
| 2015 | $1,393 | $34,802 | $3,000 | $31,802 |
| 2014 | $1,427 | $34,802 | $3,000 | $31,802 |
| 2013 | -- | $34,802 | $3,000 | $31,802 |
Source: Public Records
Map
Nearby Homes
- 2004 4th St SE
- 2005 S Main St
- 301 Camellia Dr
- 1935 4th St SE
- 2720 Jacqueline Cir
- 2216 Azalea Dr
- 2301 S Main St
- 204 Nandina Dr
- 1821 3rd St SE
- 1841 S Main St
- 35 Sloans Village Way SE
- 44 Sloans Village Way SE
- 1820 10th St SE
- 1816 S Main St
- 304 Tallokas Rd
- 1732 4th St SE
- 1701 10th St SE
- 00 Southern Trail
- 1549 Ivy Ln
- 1546 Ivy Ln
Your Personal Tour Guide
Ask me questions while you tour the home.