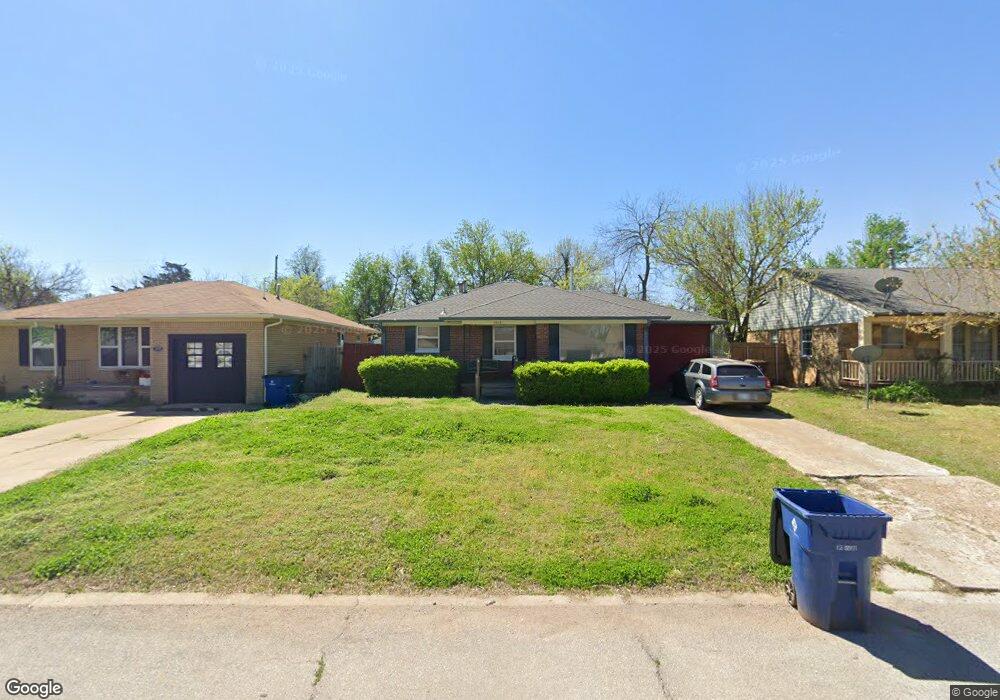
2012 Andover Ct Oklahoma City, OK 73120
Estimated Value: $164,000 - $184,000
2
Beds
1
Bath
1,055
Sq Ft
$165/Sq Ft
Est. Value
About This Home
This home is located at 2012 Andover Ct, Oklahoma City, OK 73120 and is currently estimated at $174,034, approximately $164 per square foot. 2012 Andover Ct is a home located in Oklahoma County with nearby schools including Ridgeview Elementary School, John Marshall Enterprise Middle School, and John Marshall Enterprise High School.
Ownership History
Date
Name
Owned For
Owner Type
Purchase Details
Closed on
Dec 5, 2003
Sold by
Primo Lydia Lenore and Primo Daniel J
Bought by
Henagar Dewayne L
Current Estimated Value
Purchase Details
Closed on
Jun 5, 2000
Sold by
Maxwell Lydia L
Bought by
Maxwell Lydia L
Home Financials for this Owner
Home Financials are based on the most recent Mortgage that was taken out on this home.
Original Mortgage
$20,000
Interest Rate
8.15%
Purchase Details
Closed on
May 29, 1998
Sold by
Jefferies Robert H
Bought by
Maxwell Lydia L
Create a Home Valuation Report for This Property
The Home Valuation Report is an in-depth analysis detailing your home's value as well as a comparison with similar homes in the area
Home Values in the Area
Average Home Value in this Area
Purchase History
| Date | Buyer | Sale Price | Title Company |
|---|---|---|---|
| Henagar Dewayne L | $75,000 | Capitol Abstract & Title | |
| Maxwell Lydia L | -- | -- | |
| Maxwell Lydia L | -- | -- | |
| Maxwell Lydia L | $45,500 | Oklahoma Title & Closing Co |
Source: Public Records
Mortgage History
| Date | Status | Borrower | Loan Amount |
|---|---|---|---|
| Previous Owner | Maxwell Lydia L | $20,000 |
Source: Public Records
Tax History Compared to Growth
Tax History
| Year | Tax Paid | Tax Assessment Tax Assessment Total Assessment is a certain percentage of the fair market value that is determined by local assessors to be the total taxable value of land and additions on the property. | Land | Improvement |
|---|---|---|---|---|
| 2024 | $1,467 | $12,823 | $2,288 | $10,535 |
| 2023 | $1,467 | $12,213 | $2,300 | $9,913 |
| 2022 | $1,340 | $11,630 | $1,980 | $9,650 |
| 2021 | $1,239 | $11,077 | $2,041 | $9,036 |
| 2020 | $1,164 | $10,550 | $2,151 | $8,399 |
| 2019 | $1,113 | $10,048 | $2,018 | $8,030 |
| 2018 | $1,006 | $9,570 | $0 | $0 |
| 2017 | $955 | $9,734 | $1,817 | $7,917 |
| 2016 | $933 | $9,459 | $1,817 | $7,642 |
| 2015 | $920 | $9,300 | $1,817 | $7,483 |
| 2014 | $896 | $9,110 | $1,871 | $7,239 |
Source: Public Records
Map
Nearby Homes
- 2008 Andover Ct
- 2005 Brighton Ave
- 1913 Andover Ct
- 2028 Carlisle Rd
- 2109 Brighton Ave
- 1829 Westchester Dr
- 1916 Hasley Dr
- 2020 Hasley Dr
- 2128 Westchester Dr
- 1738 Westchester Dr
- 1823 Dorchester Dr
- 1801 Drakestone Ave
- 1731 Carlisle Rd
- 1908 Dorchester Dr
- 2344 W Britton Rd
- 1825 Sheffield Rd
- 2802 W Britton Rd
- 1710 Carlisle Rd
- 2365 W Britton Rd
- 2826 Guilford Ln
- 2016 Andover Ct
- 2020 Andover Ct
- 2013 Brighton Ave
- 2009 Brighton Ave
- 2017 Brighton Ave
- 2024 Andover Ct
- 2021 Brighton Ave
- 2000 Andover Ct
- 2009 Andover Ct
- 2017 Andover Ct
- 2001 Brighton Ave
- 2021 Andover Ct
- 2005 Andover Ct
- 2025 Brighton Ave
- 1924 Andover Ct
- 2025 Andover Ct
- 2001 Andover Ct
- 1925 Brighton Ave
- 2029 Brighton Ave
- 2032 Andover Ct