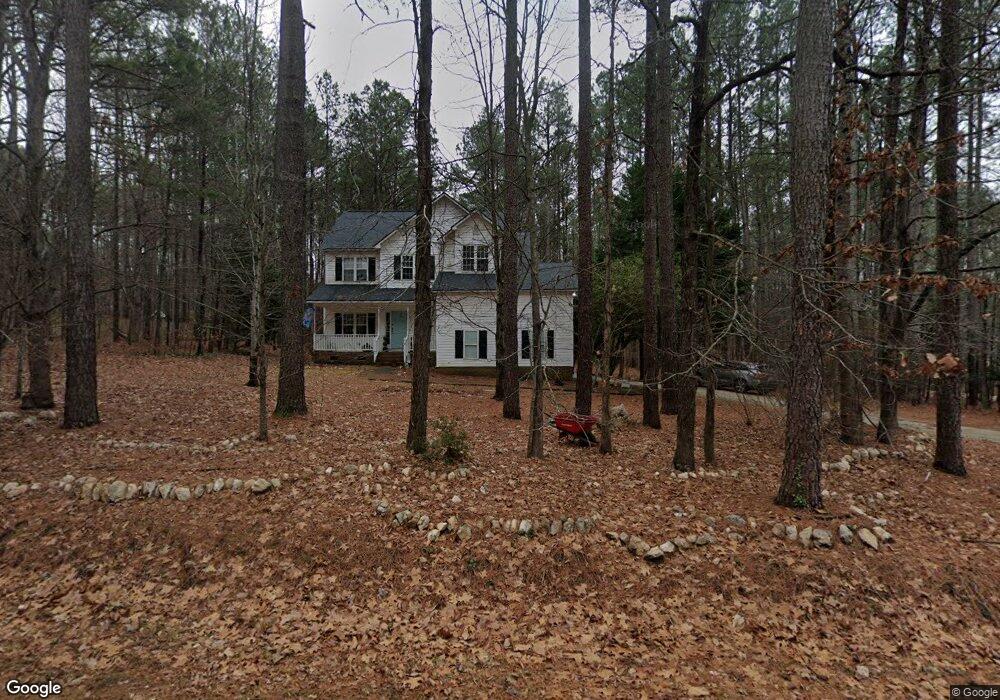
2012 Brass Ct Franklinton, NC 27525
Estimated Value: $364,000 - $390,000
3
Beds
3
Baths
1,904
Sq Ft
$198/Sq Ft
Est. Value
About This Home
This home is located at 2012 Brass Ct, Franklinton, NC 27525 and is currently estimated at $377,064, approximately $198 per square foot. 2012 Brass Ct is a home located in Granville County with nearby schools including Tar River Elementary School, G.C. Hawley Middle School, and South Granville High School.
Ownership History
Date
Name
Owned For
Owner Type
Purchase Details
Closed on
Mar 31, 2025
Sold by
Grady Amanda and Williams Michael S
Bought by
Grady Amanda and Williams Michael S
Current Estimated Value
Home Financials for this Owner
Home Financials are based on the most recent Mortgage that was taken out on this home.
Original Mortgage
$68,000
Outstanding Balance
$67,471
Interest Rate
6.85%
Mortgage Type
New Conventional
Estimated Equity
$309,593
Purchase Details
Closed on
Dec 13, 2019
Sold by
Richardson Henry B and Richardson Melissa
Bought by
Grady Amanda and Williams Michael S
Home Financials for this Owner
Home Financials are based on the most recent Mortgage that was taken out on this home.
Original Mortgage
$150,590
Interest Rate
4.5%
Mortgage Type
FHA
Purchase Details
Closed on
Jul 1, 2014
Sold by
Zammit Lacy
Bought by
Richardson Henry B
Purchase Details
Closed on
Jul 11, 2012
Sold by
Sopko Michael and Sopko Marilyn
Bought by
Richardson Henry B
Home Financials for this Owner
Home Financials are based on the most recent Mortgage that was taken out on this home.
Original Mortgage
$147,959
Interest Rate
3.58%
Mortgage Type
New Conventional
Create a Home Valuation Report for This Property
The Home Valuation Report is an in-depth analysis detailing your home's value as well as a comparison with similar homes in the area
Purchase History
| Date | Buyer | Sale Price | Title Company |
|---|---|---|---|
| Grady Amanda | -- | First American Title | |
| Grady Amanda | $185,000 | None Available | |
| Richardson Henry B | -- | None Available | |
| Richardson Henry B | $145,000 | None Available |
Source: Public Records
Mortgage History
| Date | Status | Borrower | Loan Amount |
|---|---|---|---|
| Open | Grady Amanda | $68,000 | |
| Previous Owner | Grady Amanda | $150,590 | |
| Previous Owner | Richardson Henry B | $147,959 |
Source: Public Records
Tax History
| Year | Tax Paid | Tax Assessment Tax Assessment Total Assessment is a certain percentage of the fair market value that is determined by local assessors to be the total taxable value of land and additions on the property. | Land | Improvement |
|---|---|---|---|---|
| 2025 | $2,629 | $377,679 | $42,880 | $334,799 |
| 2024 | $2,629 | $377,679 | $42,880 | $334,799 |
| 2023 | $1,847 | $200,603 | $34,741 | $165,862 |
| 2022 | $1,836 | $200,603 | $34,741 | $165,862 |
| 2021 | $1,711 | $200,603 | $34,741 | $165,862 |
| 2020 | $1,711 | $200,603 | $34,741 | $165,862 |
| 2019 | $1,777 | $200,603 | $34,741 | $165,862 |
| 2018 | $1,777 | $200,603 | $34,741 | $165,862 |
| 2016 | $1,661 | $178,278 | $34,780 | $143,498 |
| 2015 | $1,567 | $178,278 | $34,780 | $143,498 |
| 2014 | $1,567 | $178,278 | $34,780 | $143,498 |
| 2013 | -- | $178,278 | $34,780 | $143,498 |
Source: Public Records
Map
Nearby Homes
- 4106 Tall Pine Dr
- 4106 Geneva Dr
- 360 Sutherland Dr
- 4099 Oak Cir
- 2054 Flint Rock Rd
- 2013 Pratt Cir
- 1208 Montgomery Rd
- 3855 Ironwood Dr
- 2128 Turquoise Ln
- 1710 Eddy Ct
- 1722 River Run Ct
- 2099 Oak Hill Dr Unit 20
- 4131 Morton Ln
- 2103 Troys Trail
- 1727 River Run Ct
- 1726 Rapids Ct
- 60 Jessup Dr
- 3812 Ironwood Dr
- 70 Cole Cir
- 4330 Medicus Ln
- LOT 13 Brass Ct
- LOT 18 Brass Ct
- LOT 14 Brass Ct
- LOT 15 Brass Ct
- Lot 19 Brass Ct
- 2014 Brass Ct
- 2011 Brass Ct
- 2017 Brass Ct
- 0 Brass Ct Unit 2034753
- LOT 17 Brass
- 0 Brass Ct Unit Lot 19 TR2034753
- 2015 Brass Ct
- 2013 Brass Ct
- 4101 Tall Pine Dr
- 0 Tall Pine Dr Unit TR2034761
- LOT 24 Tall Pine Dr
- 2015 Periwinkle Ct
- LOT 41 Tall Pine Dr
- LOT 23 Tall Pine Dr
- LOT 34 Tall Pine Dr
Your Personal Tour Guide
Ask me questions while you tour the home.