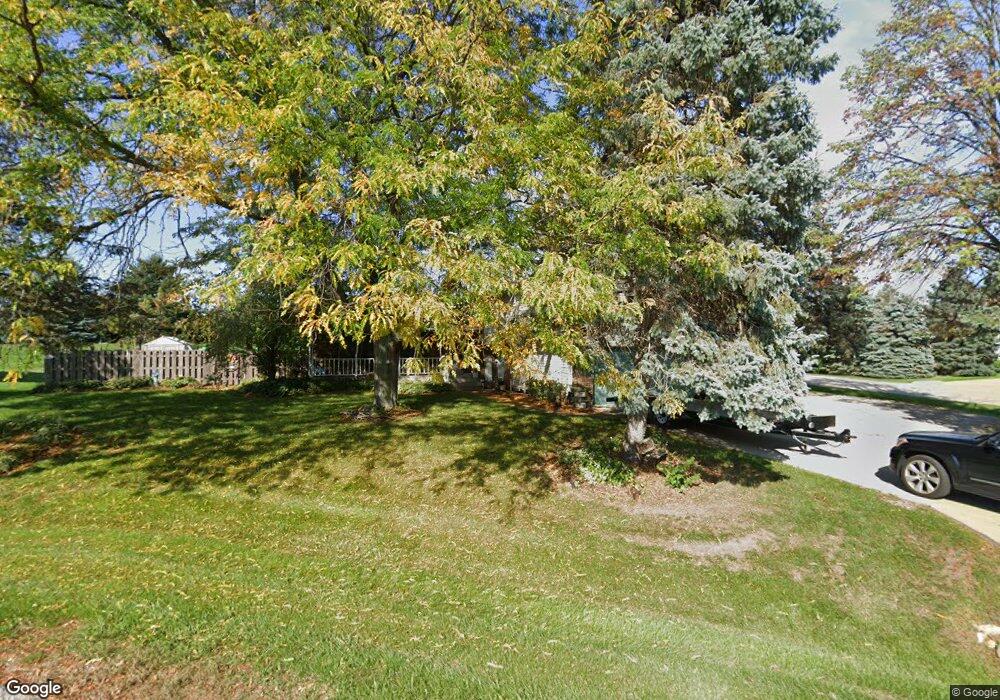
2012 Camden Ct Johnsburg, IL 60051
Estimated Value: $378,784 - $452,000
Studio
--
Bath
1,758
Sq Ft
$241/Sq Ft
Est. Value
About This Home
This home is located at 2012 Camden Ct, Johnsburg, IL 60051 and is currently estimated at $422,946, approximately $240 per square foot. 2012 Camden Ct is a home located in McHenry County with nearby schools including Ringwood School Primary Center, Johnsburg Elementary School, and Johnsburg Jr High School.
Ownership History
Date
Name
Owned For
Owner Type
Purchase Details
Closed on
Aug 28, 2002
Sold by
Valentin Kurt Thomas and Meyers Susan Mary
Bought by
Rowe Scott M and Rowe Stephanie M
Current Estimated Value
Home Financials for this Owner
Home Financials are based on the most recent Mortgage that was taken out on this home.
Original Mortgage
$200,000
Outstanding Balance
$85,495
Interest Rate
6.56%
Estimated Equity
$337,451
Purchase Details
Closed on
Dec 14, 1993
Sold by
Meyers Susan Mary
Bought by
Meyers Susan Mary and Valentin Kurt Thomas
Home Financials for this Owner
Home Financials are based on the most recent Mortgage that was taken out on this home.
Original Mortgage
$120,000
Interest Rate
7.15%
Purchase Details
Closed on
Dec 6, 1993
Sold by
Mchenry State Bank
Bought by
Meyers Susan Mary
Home Financials for this Owner
Home Financials are based on the most recent Mortgage that was taken out on this home.
Original Mortgage
$120,000
Interest Rate
7.15%
Create a Home Valuation Report for This Property
The Home Valuation Report is an in-depth analysis detailing your home's value as well as a comparison with similar homes in the area
Home Values in the Area
Average Home Value in this Area
Purchase History
| Date | Buyer | Sale Price | Title Company |
|---|---|---|---|
| Rowe Scott M | $250,000 | Universal Title Services Inc | |
| Meyers Susan Mary | -- | Land Title Group | |
| Meyers Susan Mary | -- | Land Title Group |
Source: Public Records
Mortgage History
| Date | Status | Borrower | Loan Amount |
|---|---|---|---|
| Open | Rowe Scott M | $200,000 | |
| Previous Owner | Meyers Susan Mary | $120,000 | |
| Closed | Rowe Scott M | $25,000 |
Source: Public Records
Tax History
| Year | Tax Paid | Tax Assessment Tax Assessment Total Assessment is a certain percentage of the fair market value that is determined by local assessors to be the total taxable value of land and additions on the property. | Land | Improvement |
|---|---|---|---|---|
| 2024 | $8,522 | $129,230 | $19,449 | $109,781 |
| 2023 | $8,338 | $115,776 | $17,424 | $98,352 |
| 2022 | $8,074 | $107,409 | $16,165 | $91,244 |
| 2021 | $7,702 | $100,027 | $15,054 | $84,973 |
| 2020 | $7,471 | $95,857 | $14,426 | $81,431 |
| 2019 | $7,358 | $91,024 | $13,699 | $77,325 |
| 2018 | $7,143 | $86,897 | $13,078 | $73,819 |
| 2017 | $6,952 | $81,555 | $12,274 | $69,281 |
| 2016 | $6,873 | $76,220 | $11,471 | $64,749 |
| 2013 | -- | $75,043 | $11,295 | $63,748 |
Source: Public Records
Map
Nearby Homes
- 4802 Brorson Ln
- 3703 Spring Grove Rd
- 4415 Mayfair Dr
- 2312 Dakota Ridge
- 5103 Autumn Way
- 1802 Channel Beach Ave
- 1322 Lakeview St
- Lot 34 & 35 Cedar Creek Dr
- 1001 W Broadway St
- 0 Sweet Water Ln
- 912 River Terrace Dr
- 1304 River Terrace Dr
- Lot 11 Blk 4 Acorn Ln
- 615 W Eastern Ave
- 4407 Red Tail Ln
- 4307 Red Tail Ln
- 4403 Red Tail Ln
- 4411 Red Tail Ln
- 4507 Red Tail Ln
- 5010 Woodrow Ave
- 2016 Camden Ct
- 5020 Hickory Way
- 2020 Camden Ct
- 2013 Camden Ct
- 5018 Hickory Way
- 2017 Camden Ct
- 1901 Heather Ln
- 5014 Hickory Way
- 5016 Country Oaks Dr
- 5009 Hickory Way
- 5010 Hickory Way
- 1903 Heather Ln
- 5012 Country Oaks Dr
- 1905 Heather Ln
- 2020 Devon Ln
- 2014 Devon Ln
- 5020 Country Oaks Dr
- 5008 Country Oaks Dr
- 5002 Hickory Way
- 1902 Heather Ln
Your Personal Tour Guide
Ask me questions while you tour the home.