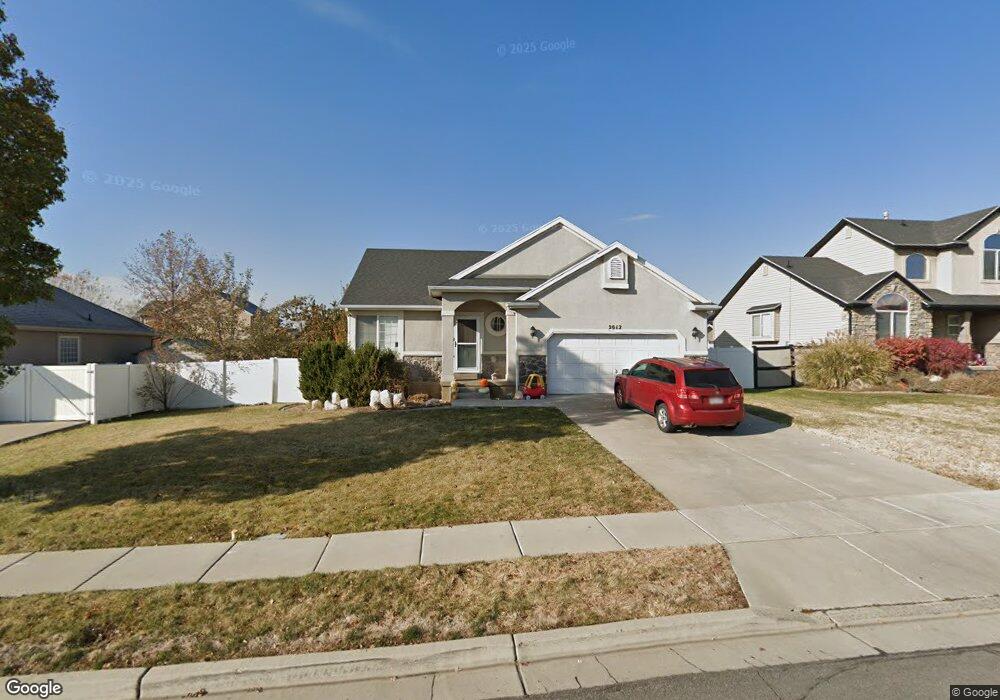
2012 Chelemes Way Clearfield, UT 84015
Estimated Value: $467,000 - $496,000
3
Beds
2
Baths
2,600
Sq Ft
$187/Sq Ft
Est. Value
About This Home
This home is located at 2012 Chelemes Way, Clearfield, UT 84015 and is currently estimated at $485,692, approximately $186 per square foot. 2012 Chelemes Way is a home located in Davis County with nearby schools including Antelope Elementary School, North Davis Junior High School, and Clearfield High School.
Ownership History
Date
Name
Owned For
Owner Type
Purchase Details
Closed on
Sep 24, 2018
Sold by
Morris Nathan K and Morris Julie M
Bought by
Magness John G and Magness Claudia
Current Estimated Value
Purchase Details
Closed on
Jul 15, 2003
Sold by
Morris Nathan Kenji
Bought by
Morris Nathan K and Morris Julie M
Home Financials for this Owner
Home Financials are based on the most recent Mortgage that was taken out on this home.
Original Mortgage
$143,900
Interest Rate
5.18%
Mortgage Type
Purchase Money Mortgage
Create a Home Valuation Report for This Property
The Home Valuation Report is an in-depth analysis detailing your home's value as well as a comparison with similar homes in the area
Home Values in the Area
Average Home Value in this Area
Purchase History
| Date | Buyer | Sale Price | Title Company |
|---|---|---|---|
| Magness John G | -- | Inwest Title Service | |
| Morris Nathan K | -- | Aspen Title Insurance Agency |
Source: Public Records
Mortgage History
| Date | Status | Borrower | Loan Amount |
|---|---|---|---|
| Previous Owner | Morris Nathan K | $143,900 |
Source: Public Records
Tax History Compared to Growth
Tax History
| Year | Tax Paid | Tax Assessment Tax Assessment Total Assessment is a certain percentage of the fair market value that is determined by local assessors to be the total taxable value of land and additions on the property. | Land | Improvement |
|---|---|---|---|---|
| 2025 | $4,899 | $439,000 | $133,936 | $305,064 |
| 2024 | $4,741 | $235,399 | $70,417 | $164,982 |
| 2023 | $4,532 | $227,150 | $61,903 | $165,246 |
| 2022 | $5,178 | $464,000 | $116,969 | $347,031 |
| 2021 | $4,566 | $340,000 | $69,058 | $270,942 |
| 2020 | $4,097 | $303,000 | $58,200 | $244,800 |
| 2019 | $2,132 | $283,000 | $60,541 | $222,459 |
| 2018 | $2,119 | $274,000 | $53,736 | $220,264 |
| 2016 | $1,887 | $127,545 | $21,509 | $106,036 |
| 2015 | $1,869 | $120,450 | $21,509 | $98,941 |
| 2014 | $1,934 | $126,313 | $21,509 | $104,804 |
| 2013 | -- | $99,163 | $37,125 | $62,038 |
Source: Public Records
Map
Nearby Homes
- 2002 Chelemes Way
- 2022 Chelemes Way
- 2013 S 350 E
- 2003 S 350 E
- 2023 S 350 E
- 2011 Chelemes Way
- 1994 Chelemes Way
- 439 E 2025 S
- 1993 S 350 E
- 2032 Chelemes Way
- 2037 S 350 E
- 1974 Chelemes Way
- 2001 Chelemes Way
- 1979 S 350 E
- 2014 S 350 E
- 459 E 2025 S
- 2024 S 350 E
- 2004 S 350 E
- 2004 S 350 E Unit 34
- 428 E 2025 S