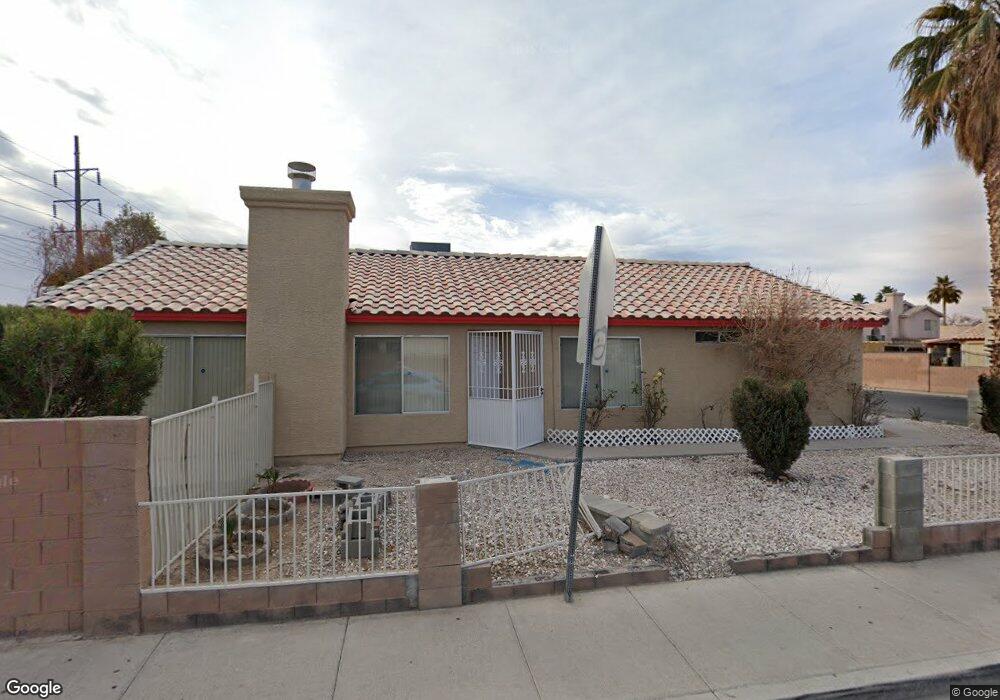
2012 Crowley Way Las Vegas, NV 89142
Estimated Value: $361,827 - $373,000
3
Beds
2
Baths
1,337
Sq Ft
$276/Sq Ft
Est. Value
About This Home
This home is located at 2012 Crowley Way, Las Vegas, NV 89142 and is currently estimated at $369,457, approximately $276 per square foot. 2012 Crowley Way is a home located in Clark County with nearby schools including John F. Mendoza Elementary School, Duane D. Keller Middle School, and Las Vegas High School.
Ownership History
Date
Name
Owned For
Owner Type
Purchase Details
Closed on
Jul 13, 2019
Sold by
Reynado Roy
Bought by
Reynado Roy and Reynado Ryan
Current Estimated Value
Home Financials for this Owner
Home Financials are based on the most recent Mortgage that was taken out on this home.
Original Mortgage
$82,900
Interest Rate
3.6%
Mortgage Type
New Conventional
Purchase Details
Closed on
May 24, 2005
Sold by
Reynando Roy and Renado Roy
Bought by
Reynado Roy
Home Financials for this Owner
Home Financials are based on the most recent Mortgage that was taken out on this home.
Original Mortgage
$120,000
Interest Rate
5.72%
Mortgage Type
New Conventional
Purchase Details
Closed on
Jul 12, 2002
Sold by
Reynado Crisela
Bought by
Reynado Ryan
Purchase Details
Closed on
Jul 2, 2002
Sold by
Reynado Marianito P and Reynado Rena E
Bought by
Renado Roy and Reynado Ryan
Create a Home Valuation Report for This Property
The Home Valuation Report is an in-depth analysis detailing your home's value as well as a comparison with similar homes in the area
Home Values in the Area
Average Home Value in this Area
Purchase History
| Date | Buyer | Sale Price | Title Company |
|---|---|---|---|
| Reynado Roy | $152,289 | Vantage Point Title Inc | |
| Reynado Roy | -- | Nevada Title Company | |
| Reynado Ryan | -- | Nevada Title Company | |
| Renado Roy | -- | Nevada Title Company |
Source: Public Records
Mortgage History
| Date | Status | Borrower | Loan Amount |
|---|---|---|---|
| Previous Owner | Reynado Roy | $82,900 | |
| Previous Owner | Reynado Roy | $120,000 |
Source: Public Records
Tax History Compared to Growth
Tax History
| Year | Tax Paid | Tax Assessment Tax Assessment Total Assessment is a certain percentage of the fair market value that is determined by local assessors to be the total taxable value of land and additions on the property. | Land | Improvement |
|---|---|---|---|---|
| 2025 | $1,205 | $67,817 | $22,750 | $45,067 |
| 2024 | $1,116 | $67,817 | $22,750 | $45,067 |
| 2023 | $765 | $69,255 | $26,250 | $43,005 |
| 2022 | $1,034 | $61,212 | $21,700 | $39,512 |
| 2021 | $958 | $57,663 | $19,950 | $37,713 |
| 2020 | $886 | $56,506 | $18,900 | $37,606 |
| 2019 | $831 | $53,301 | $16,100 | $37,201 |
| 2018 | $806 | $49,232 | $13,300 | $35,932 |
| 2017 | $1,358 | $46,312 | $9,800 | $36,512 |
| 2016 | $765 | $41,474 | $8,400 | $33,074 |
| 2015 | $762 | $30,346 | $5,600 | $24,746 |
| 2014 | $738 | $24,699 | $5,250 | $19,449 |
Source: Public Records
Map
Nearby Homes
- 5849 Emerald Canyon Dr
- 2229 Bowstring Dr
- 1950 Turtlerock St
- 1841 Skywood Way
- 2307 Tuscarora Ct
- 1631 Mapleleaf St
- 1747 Angel Falls St
- 2179 Raspberry Hill Rd
- 1927 Raspberry Hill Rd
- 5650 E Sahara Ave Unit 2007
- 5650 E Sahara Ave Unit 1035
- 2306 Abarth St
- 1728 S Christy Ln
- 1950 Abarth St
- 1745 Starridge Way
- 5655 E Sahara Ave Unit 2048
- 5655 E Sahara Ave Unit 2009
- 5655 E Sahara Ave Unit 1003
- 5655 E Sahara Ave Unit 2068
- 5655 E Sahara Ave Unit 2020
- 2022 Crowley Way
- 2032 Crowley Way
- 2032 Crowley Way
- 2032 Crowley Way
- 2032 Crowley Way
- 1998 Crowley Way
- 2042 Crowley Way
- 5783 Ballinger Dr
- 2052 Crowley Way
- 1978 Crowley Way
- 5775 Ballinger Dr
- 5784 Akron Ct
- 1997 Crowley Way
- 2062 Crowley Way
- 5776 Akron Ct
- 5767 Ballinger Dr
- 1958 Crowley Way
- 1977 Crowley Way Unit 8
- 5768 Akron Ct
- 2072 Crowley Way