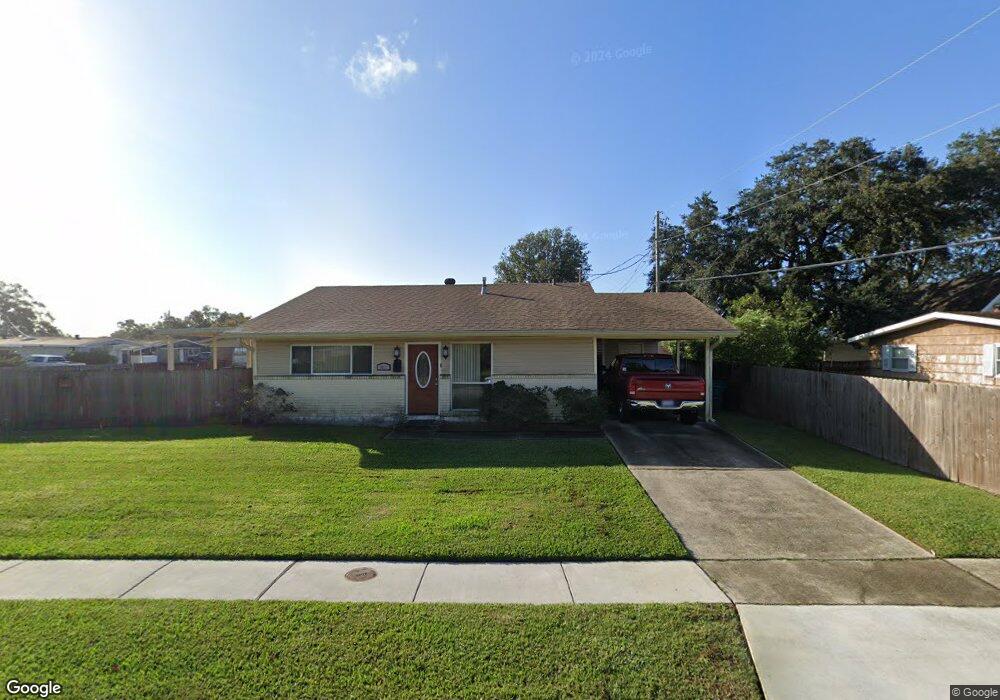
2012 Dartmouth St Terrytown, LA 70056
Estimated Value: $155,885 - $236,000
3
Beds
2
Baths
1,250
Sq Ft
$159/Sq Ft
Est. Value
About This Home
This home is located at 2012 Dartmouth St, Terrytown, LA 70056 and is currently estimated at $198,971, approximately $159 per square foot. 2012 Dartmouth St is a home located in Jefferson Parish with nearby schools including Terrytown Elementary School, Gretna No. 2 Academy for Advanced Studies, and Livaudais Middle School.
Ownership History
Date
Name
Owned For
Owner Type
Purchase Details
Closed on
Nov 23, 2019
Sold by
Piglia Ronald A
Bought by
Pigla Ronald A and Piglia Tammy
Current Estimated Value
Home Financials for this Owner
Home Financials are based on the most recent Mortgage that was taken out on this home.
Original Mortgage
$122,232
Outstanding Balance
$107,317
Interest Rate
3.5%
Mortgage Type
FHA
Estimated Equity
$91,654
Purchase Details
Closed on
May 17, 2010
Sold by
Grosch Anthony J
Bought by
Piglia Ronald A
Home Financials for this Owner
Home Financials are based on the most recent Mortgage that was taken out on this home.
Original Mortgage
$135,876
Interest Rate
5.14%
Mortgage Type
FHA
Purchase Details
Closed on
Oct 14, 2009
Sold by
Green Tree Servicing Llc
Bought by
Grosch Anthony
Create a Home Valuation Report for This Property
The Home Valuation Report is an in-depth analysis detailing your home's value as well as a comparison with similar homes in the area
Home Values in the Area
Average Home Value in this Area
Purchase History
| Date | Buyer | Sale Price | Title Company |
|---|---|---|---|
| Pigla Ronald A | -- | None Available | |
| Piglia Ronald A | $139,000 | -- | |
| Grosch Anthony | $34,650 | -- |
Source: Public Records
Mortgage History
| Date | Status | Borrower | Loan Amount |
|---|---|---|---|
| Open | Pigla Ronald A | $122,232 | |
| Previous Owner | Piglia Ronald A | $135,876 |
Source: Public Records
Tax History Compared to Growth
Tax History
| Year | Tax Paid | Tax Assessment Tax Assessment Total Assessment is a certain percentage of the fair market value that is determined by local assessors to be the total taxable value of land and additions on the property. | Land | Improvement |
|---|---|---|---|---|
| 2024 | $4,766 | $13,920 | $3,960 | $9,960 |
| 2023 | $800 | $13,620 | $3,960 | $9,660 |
| 2022 | $1,735 | $13,620 | $3,960 | $9,660 |
| 2021 | $1,636 | $13,620 | $3,960 | $9,660 |
| 2020 | $1,624 | $13,620 | $3,960 | $9,660 |
| 2019 | $1,666 | $13,620 | $3,960 | $9,660 |
| 2018 | $699 | $13,620 | $3,960 | $9,660 |
| 2017 | $1,491 | $13,620 | $3,960 | $9,660 |
| 2016 | $1,461 | $13,620 | $3,960 | $9,660 |
| 2015 | $671 | $13,900 | $3,790 | $10,110 |
| 2014 | $671 | $13,900 | $3,790 | $10,110 |
Source: Public Records
Map
Nearby Homes
- 519 Delmar St
- 564 Deerfield Rd
- 2124 Dupont Dr
- 1932 Stumpf Blvd
- 570 Dover Ln
- 419 Terry Pkwy
- 574 Dover Ln
- 423 Bruce Ave
- 518 Diplomat St
- 548 Diplomat St
- 2135 Deerfield Rd
- 1918 Farmington Place
- 129 Holmes Blvd
- 125 Holmes Blvd
- 123 Holmes Blvd
- 121 Holmes Blvd
- 131 Holmes Blvd
- 127 Holmes Blvd
- 133 Holmes Blvd
- 1912 Cooper Rd
- 510 Dunbar Place
- 2015 Dartmouth St
- 512 Dunbar Place
- 509 Delmar St
- 2013 Dartmouth St
- 509 Dunbar Place
- 505 Delmar St
- 2017 Dartmouth St
- 523 Delmar St
- 511 Dunbar Place
- 514 Dunbar Place
- 513 Dunbar Place
- 515 Dunbar Place
- 2019 Dartmouth St
- 503 Delmar St
- 2020 Dartmouth St
- 2010 Dupont Dr
- 2012 Dupont Dr
- 516 Dunbar Place
- 527 Delmar St