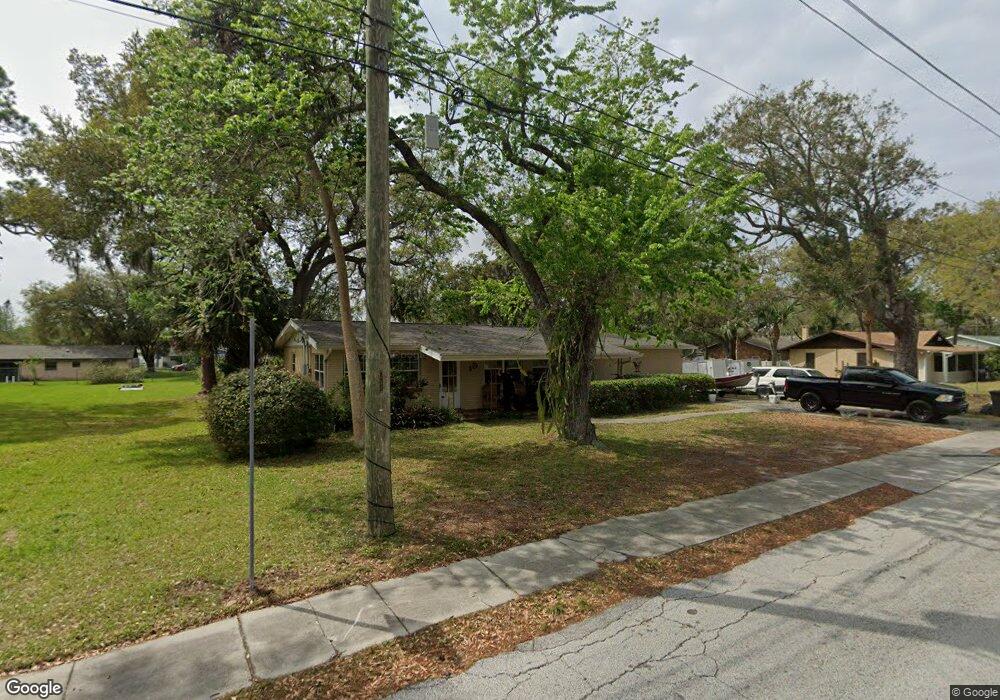
2012 Graham St South Daytona, FL 32119
Estimated Value: $256,000 - $278,000
3
Beds
2
Baths
1,492
Sq Ft
$177/Sq Ft
Est. Value
About This Home
This home is located at 2012 Graham St, South Daytona, FL 32119 and is currently estimated at $263,928, approximately $176 per square foot. 2012 Graham St is a home located in Volusia County with nearby schools including South Daytona Elementary School, Atlantic High School, and Campbell Middle School.
Ownership History
Date
Name
Owned For
Owner Type
Purchase Details
Closed on
Mar 12, 2012
Sold by
The Bank Of New York Mellon
Bought by
Tomlinson Wayne and Tomlinson Linda
Current Estimated Value
Purchase Details
Closed on
Jul 30, 2010
Sold by
Young Jennifer
Bought by
The Bank Of New York Mellon and The Bank Of New York
Purchase Details
Closed on
Jun 30, 2004
Sold by
Martin Joseph Mitchell
Bought by
Young Jennifer
Home Financials for this Owner
Home Financials are based on the most recent Mortgage that was taken out on this home.
Original Mortgage
$128,250
Interest Rate
6.25%
Mortgage Type
Purchase Money Mortgage
Purchase Details
Closed on
Mar 26, 2004
Sold by
Ridenbaugh Laurianne
Bought by
Ridenbaugh Frank
Purchase Details
Closed on
Mar 20, 2000
Sold by
Allen Stanley L
Bought by
Martin Joseph Mitchell
Purchase Details
Closed on
Jan 15, 1998
Sold by
Vanhorn Douglas K and Vanhorn Judity A
Bought by
Allen Stanley L
Create a Home Valuation Report for This Property
The Home Valuation Report is an in-depth analysis detailing your home's value as well as a comparison with similar homes in the area
Home Values in the Area
Average Home Value in this Area
Purchase History
| Date | Buyer | Sale Price | Title Company |
|---|---|---|---|
| Tomlinson Wayne | $62,800 | Landsafe Title | |
| The Bank Of New York Mellon | -- | None Available | |
| Young Jennifer | $135,000 | Associated Land Title Group | |
| Ridenbaugh Frank | -- | -- | |
| Martin Joseph Mitchell | $75,000 | -- | |
| Allen Stanley L | $44,000 | -- |
Source: Public Records
Mortgage History
| Date | Status | Borrower | Loan Amount |
|---|---|---|---|
| Previous Owner | Young Jennifer | $128,250 |
Source: Public Records
Tax History Compared to Growth
Tax History
| Year | Tax Paid | Tax Assessment Tax Assessment Total Assessment is a certain percentage of the fair market value that is determined by local assessors to be the total taxable value of land and additions on the property. | Land | Improvement |
|---|---|---|---|---|
| 2025 | $3,428 | $240,603 | $56,896 | $183,707 |
| 2024 | $3,428 | $243,228 | $55,285 | $187,943 |
| 2023 | $3,428 | $188,037 | $68,704 | $119,333 |
| 2022 | $3,121 | $165,586 | $48,844 | $116,742 |
| 2021 | $2,897 | $135,892 | $44,014 | $91,878 |
| 2020 | $2,738 | $129,556 | $34,352 | $95,204 |
| 2019 | $2,501 | $120,540 | $32,700 | $87,840 |
| 2018 | $2,344 | $115,247 | $28,340 | $86,907 |
| 2017 | $2,234 | $109,470 | $28,321 | $81,149 |
| 2016 | $2,029 | $94,501 | $0 | $0 |
| 2015 | $1,900 | $84,727 | $0 | $0 |
| 2014 | $1,730 | $75,387 | $0 | $0 |
Source: Public Records
Map
Nearby Homes
- 2014 Graham St
- 2061 Oriole Ln
- 2009 Brian Ave
- 638 Aurora St
- 2051 Green St
- 2031 Mike St
- 618 Aurora St
- 2100 Brian Ave
- 784 Little Pine Dr
- 781 Aspen Dr
- 2217 Green St
- 786 Little Pine Dr
- 518 Katherine St
- 705 Largo Way
- 1930 S Ridgewood Ave Unit 11
- 1930 S Ridgewood Ave Unit A20
- 1930 S Ridgewood Ave Unit 28
- 1930 S Ridgewood Ave Unit 20B
- 1951 Red Cedar Cir
- 2261 Anastasia Dr
- 2006 Graham St
- 2023 Kenilworth Ave
- 2021 Kenilworth Ave
- 2025 Kenilworth Ave
- 538 Blake Rd
- 539 Blake Rd
- 2020 Graham St
- 701 Big Tree Rd
- 703 Big Tree Rd
- 2011 Kenilworth Ave
- 536 Blake Rd
- 535 Blake Rd
- 574 Lambright Rd
- 2020 Kenilworth Ave
- 2001 Kenilworth Ave
- 635 Big Tree Rd
- 2010 Kenilworth Ave
- 2040 Kenilworth Ave
- 2004 Kenilworth Ave
- 532 Blake Rd