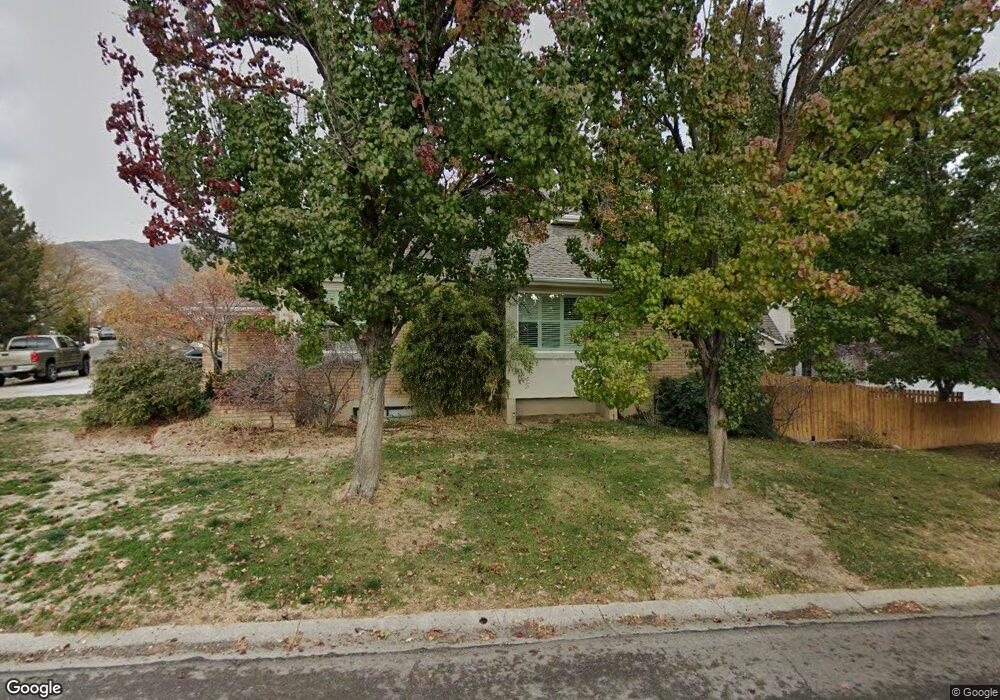
2012 Kingston Rd Farmington, UT 84025
Estimated Value: $774,000 - $920,000
6
Beds
4
Baths
4,154
Sq Ft
$198/Sq Ft
Est. Value
About This Home
This home is located at 2012 Kingston Rd, Farmington, UT 84025 and is currently estimated at $820,890, approximately $197 per square foot. 2012 Kingston Rd is a home located in Davis County with nearby schools including Knowlton Elementary School, Farmington High, and Farmington Junior High School.
Ownership History
Date
Name
Owned For
Owner Type
Purchase Details
Closed on
Nov 28, 2017
Sold by
Iverson James and Iverson Sarah
Bought by
Mebius Richard T and Mebius Alisa M
Current Estimated Value
Purchase Details
Closed on
Jul 30, 2003
Sold by
Iverson James Grant and Iverson Sarah S
Bought by
Iverson James and Iverson Sarah
Home Financials for this Owner
Home Financials are based on the most recent Mortgage that was taken out on this home.
Original Mortgage
$200,000
Interest Rate
5.13%
Mortgage Type
Purchase Money Mortgage
Purchase Details
Closed on
Jun 15, 2002
Sold by
Flores Brad H and Flores Cheri L
Bought by
Iverson James Grant and Iverson Sarah S
Purchase Details
Closed on
Feb 17, 1998
Sold by
Hoof David M and Hoof Susan M
Bought by
Flores Brad H and Flores Cheri L
Home Financials for this Owner
Home Financials are based on the most recent Mortgage that was taken out on this home.
Original Mortgage
$227,150
Interest Rate
6.97%
Create a Home Valuation Report for This Property
The Home Valuation Report is an in-depth analysis detailing your home's value as well as a comparison with similar homes in the area
Home Values in the Area
Average Home Value in this Area
Purchase History
| Date | Buyer | Sale Price | Title Company |
|---|---|---|---|
| Mebius Richard T | -- | Security Title | |
| Iverson James | -- | Monument Title Agency | |
| Iverson James Grant | -- | First American Title Co | |
| Flores Brad H | -- | Security Title Company |
Source: Public Records
Mortgage History
| Date | Status | Borrower | Loan Amount |
|---|---|---|---|
| Previous Owner | Iverson James | $200,000 | |
| Previous Owner | Flores Brad H | $227,150 |
Source: Public Records
Tax History Compared to Growth
Tax History
| Year | Tax Paid | Tax Assessment Tax Assessment Total Assessment is a certain percentage of the fair market value that is determined by local assessors to be the total taxable value of land and additions on the property. | Land | Improvement |
|---|---|---|---|---|
| 2024 | $3,834 | $383,350 | $161,464 | $221,886 |
| 2023 | $3,765 | $686,000 | $195,962 | $490,038 |
| 2022 | $3,748 | $387,750 | $108,463 | $279,287 |
| 2021 | $3,428 | $528,000 | $148,430 | $379,570 |
| 2020 | $3,090 | $464,000 | $123,927 | $340,073 |
| 2019 | $3,124 | $455,000 | $34,000 | $421,000 |
| 2018 | $3,073 | $441,000 | $34,000 | $407,000 |
| 2016 | $2,569 | $189,805 | $69,025 | $120,780 |
| 2015 | $2,461 | $172,590 | $141,501 | $31,089 |
| 2014 | $2,431 | $175,191 | $10,310 | $164,881 |
| 2013 | -- | $163,984 | $40,533 | $123,451 |
Source: Public Records
Map
Nearby Homes
- 2076 Summerwood Dr
- 1053 Sage Ln
- 1175 W 1875 N
- 1543 Mirabella Way Unit 21
- 1043 S Oxford Cir
- 960 E Par Three Cir
- 1372 Sweetwater Ln
- 1212 Pinehurst Cir
- 830 E 1250 S
- 1789 Stayner Dr
- 1419 E Heights Way Unit 15
- 1406 Swinton Ln
- 643 Ridgewood Cir
- 1083 Tee Time Dr
- 1668 N 400 W
- 1644 E Old Lake Ln
- 407 Welling Way
- 422 W 1300 N
- 1204 N 1100 W
- 1563 N Compton Rd
- 2018 Kingston Rd
- 964 Westmorland Ct
- 1998 Kingston Rd
- 945 Burlington Ct
- 975 Westmorland Ct
- 2015 Kingston Rd
- 965 Westmorland Ct
- 2023 Kingston Rd
- 2007 Kingston Rd
- 2037 Kingston Rd
- 942 Burlington Ct
- 972 Melbourne Ct
- 2036 Kingston Rd
- 2036 Kingston Rd Unit 59
- 1978 Kingston Rd
- 2037 Kingston Rd
- 2001 Kingston Rd
- 978 Melbourne Ct
- 1958 Kingston Rd
- 1991 Kingston Rd