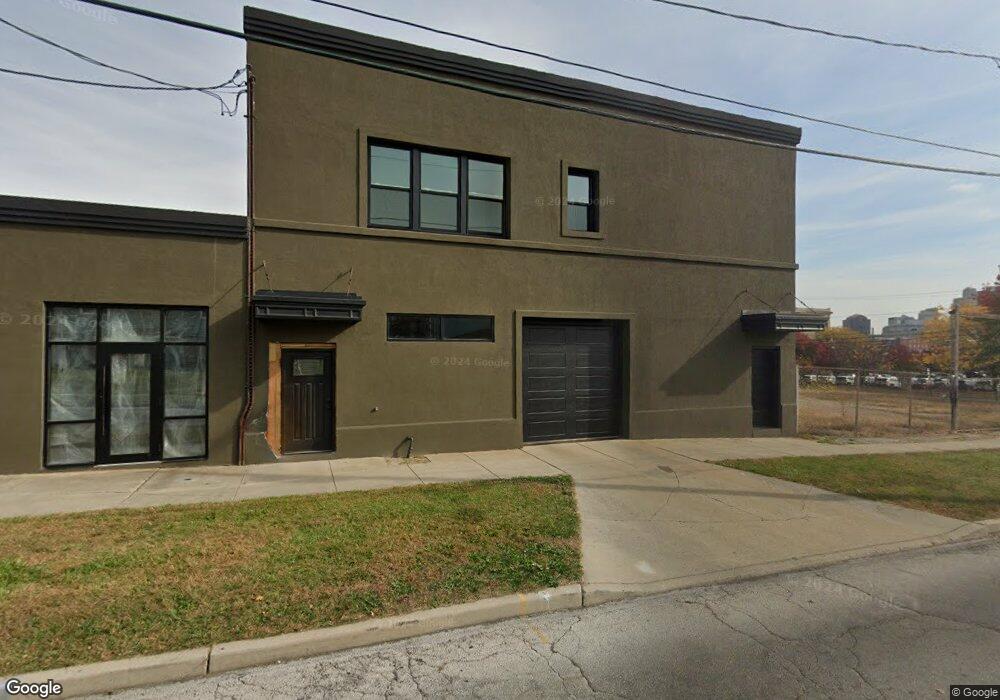
2012 N 14th St Toledo, OH 43620
Downtown Toledo Neighborhood
--
Bed
1
Bath
10,040
Sq Ft
--
Built
About This Home
This home is located at 2012 N 14th St, Toledo, OH 43620. 2012 N 14th St is a home located in Lucas County with nearby schools including Sherman Elementary School, Woodward High School, and Madison Avenue School Of Arts.
Ownership History
Date
Name
Owned For
Owner Type
Purchase Details
Closed on
Nov 10, 2022
Sold by
Blackacre Building Company
Bought by
Rg Dezigns Llc
Purchase Details
Closed on
Jun 20, 2003
Sold by
Faunce Richard L and Faunce Barry C
Bought by
Blackacre Building Co
Home Financials for this Owner
Home Financials are based on the most recent Mortgage that was taken out on this home.
Original Mortgage
$44,880
Interest Rate
4.83%
Mortgage Type
Commercial
Purchase Details
Closed on
Jan 10, 1990
Sold by
Faunce Jack A and Faunce Virginia J
Create a Home Valuation Report for This Property
The Home Valuation Report is an in-depth analysis detailing your home's value as well as a comparison with similar homes in the area
Home Values in the Area
Average Home Value in this Area
Purchase History
| Date | Buyer | Sale Price | Title Company |
|---|---|---|---|
| Rg Dezigns Llc | $130,000 | Area Title | |
| Blackacre Building Co | $56,100 | Metro Title Agency Inc | |
| -- | -- | -- |
Source: Public Records
Mortgage History
| Date | Status | Borrower | Loan Amount |
|---|---|---|---|
| Previous Owner | Blackacre Building Co | $44,880 |
Source: Public Records
Tax History Compared to Growth
Tax History
| Year | Tax Paid | Tax Assessment Tax Assessment Total Assessment is a certain percentage of the fair market value that is determined by local assessors to be the total taxable value of land and additions on the property. | Land | Improvement |
|---|---|---|---|---|
| 2024 | $11,342 | $42,665 | $5,565 | $37,100 |
| 2023 | $2,858 | $23,415 | $7,980 | $15,435 |
| 2022 | $2,834 | $23,415 | $7,980 | $15,435 |
| 2021 | $2,858 | $23,415 | $7,980 | $15,435 |
| 2020 | $2,958 | $22,295 | $7,595 | $14,700 |
| 2019 | $2,877 | $22,295 | $7,595 | $14,700 |
| 2018 | $2,874 | $22,295 | $7,595 | $14,700 |
| 2017 | $6,658 | $22,295 | $7,175 | $15,120 |
| 2016 | $6,259 | $63,700 | $20,500 | $43,200 |
| 2015 | $2,896 | $63,700 | $20,500 | $43,200 |
| 2014 | $1,934 | $22,300 | $7,180 | $15,120 |
| 2013 | $1,934 | $22,300 | $7,180 | $15,120 |
Source: Public Records
Map
Nearby Homes