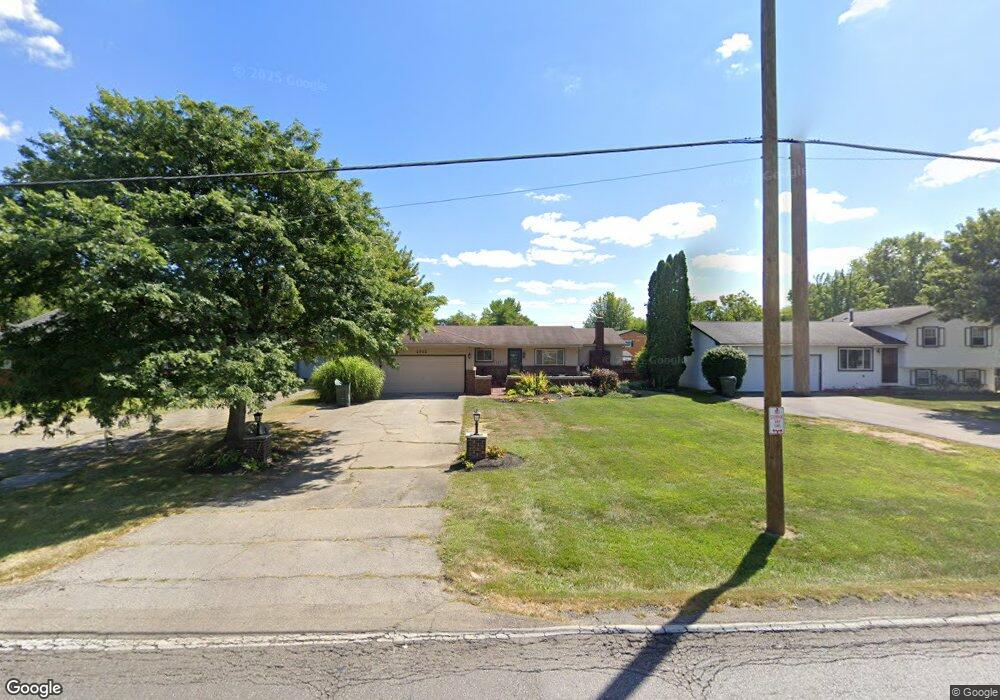
2012 N Cassady Ave Columbus, OH 43219
Cumberland Ridge NeighborhoodEstimated Value: $266,305 - $309,000
4
Beds
2
Baths
1,446
Sq Ft
$195/Sq Ft
Est. Value
About This Home
This home is located at 2012 N Cassady Ave, Columbus, OH 43219 and is currently estimated at $282,576, approximately $195 per square foot. 2012 N Cassady Ave is a home located in Franklin County with nearby schools including Cassady Elementary School, Mifflin Middle School, and Mifflin High School.
Ownership History
Date
Name
Owned For
Owner Type
Purchase Details
Closed on
Mar 17, 2003
Sold by
Watson John A and Watson Diane
Bought by
Griffin Lainya L
Current Estimated Value
Home Financials for this Owner
Home Financials are based on the most recent Mortgage that was taken out on this home.
Original Mortgage
$125,012
Outstanding Balance
$52,092
Interest Rate
5.95%
Mortgage Type
FHA
Estimated Equity
$230,484
Purchase Details
Closed on
Nov 9, 2000
Sold by
Estate Of Nancy B Watson
Bought by
Watson John A
Purchase Details
Closed on
Nov 21, 1969
Bought by
Watson John A and Watson Nancy
Create a Home Valuation Report for This Property
The Home Valuation Report is an in-depth analysis detailing your home's value as well as a comparison with similar homes in the area
Home Values in the Area
Average Home Value in this Area
Purchase History
| Date | Buyer | Sale Price | Title Company |
|---|---|---|---|
| Griffin Lainya L | $126,000 | Real Living Title | |
| Watson John A | -- | -- | |
| Watson John A | -- | -- |
Source: Public Records
Mortgage History
| Date | Status | Borrower | Loan Amount |
|---|---|---|---|
| Open | Griffin Lainya L | $125,012 |
Source: Public Records
Tax History
| Year | Tax Paid | Tax Assessment Tax Assessment Total Assessment is a certain percentage of the fair market value that is determined by local assessors to be the total taxable value of land and additions on the property. | Land | Improvement |
|---|---|---|---|---|
| 2025 | $3,541 | $78,900 | $19,710 | $59,190 |
| 2024 | $3,541 | $78,900 | $19,710 | $59,190 |
| 2023 | $3,496 | $78,890 | $19,705 | $59,185 |
| 2022 | $2,498 | $48,170 | $11,380 | $36,790 |
| 2021 | $2,503 | $48,170 | $11,380 | $36,790 |
| 2020 | $2,506 | $48,170 | $11,380 | $36,790 |
| 2019 | $2,544 | $41,940 | $11,380 | $30,560 |
| 2018 | $2,416 | $41,940 | $11,380 | $30,560 |
| 2017 | $2,534 | $41,940 | $11,380 | $30,560 |
| 2016 | $2,525 | $38,120 | $6,090 | $32,030 |
| 2015 | $2,292 | $38,120 | $6,090 | $32,030 |
| 2014 | $2,298 | $38,120 | $6,090 | $32,030 |
| 2013 | $1,193 | $40,110 | $6,405 | $33,705 |
Source: Public Records
Map
Nearby Homes
- 2803 Ballyvaughn Dr Unit 48
- 2808 Drake Rd
- 2789 Sparrow Hill Dr Unit 18
- 2526 Queenswood Dr
- 2282 Dawnlight Ave
- 3601 Agler Rd
- 2350 Edenburgh Dr S
- 0 Mock Rd
- 1822 Stelzer Rd
- 2271 Century Dr
- 3667 Parker Knoll Ln
- 3781 Aberdeen Ave
- 3775 Aberdeen Ave
- 2459 Meredith Dr
- 2310 Brentnell Ave
- 2713 Marview Rd
- 2275 Stelzer Rd
- 3118 Elmreeb Dr
- 0 Danby Dr
- 3756 Genessee Ave
- 2004 N Cassady Ave
- 2024 N Cassady Ave
- 3032 Pine Valley Rd
- 3036 Pine Valley Rd
- 2032 N Cassady Ave
- 3028 Pine Valley Rd
- 3010 E Hudson St
- 3040 Pine Valley Rd
- 2040 N Cassady Ave
- 2048 N Cassady Ave
- 3046 Pine Valley Rd
- 3039 Pine Valley Rd
- 3055 Pine Valley Rd
- 3031 Pine Valley Rd
- 3009 E Hudson St
- 3050 E Hudson St
- 3025 E Hudson St
- 3050 Pine Valley Rd
- 3025 Baylor Ave
- 3033 Baylor Ave
Your Personal Tour Guide
Ask me questions while you tour the home.