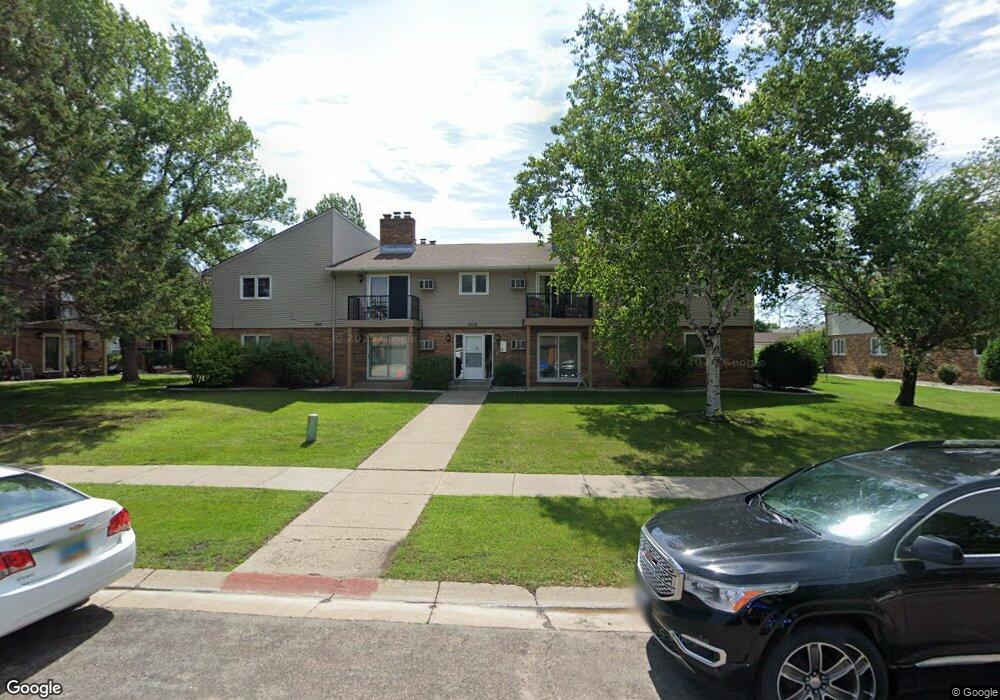
2012 Park Blvd S Unit 7 Fargo, ND 58103
South High NeighborhoodEstimated Value: $119,000 - $135,000
2
Beds
1
Bath
864
Sq Ft
$148/Sq Ft
Est. Value
About This Home
This home is located at 2012 Park Blvd S Unit 7, Fargo, ND 58103 and is currently estimated at $127,635, approximately $147 per square foot. 2012 Park Blvd S Unit 7 is a home located in Cass County with nearby schools including Lewis & Clark Elementary School, Carl Ben Eielson Middle School, and South High School.
Ownership History
Date
Name
Owned For
Owner Type
Purchase Details
Closed on
Jun 30, 2018
Sold by
Brewer Charles C and Brewer Laura B
Bought by
Erber Curtis N and Erber Joanna L
Current Estimated Value
Home Financials for this Owner
Home Financials are based on the most recent Mortgage that was taken out on this home.
Original Mortgage
$874,656
Outstanding Balance
$515,060
Interest Rate
4.5%
Mortgage Type
New Conventional
Estimated Equity
-$387,425
Purchase Details
Closed on
Jan 24, 2014
Sold by
Culp Austin and Culp Elaine P
Bought by
Brewer Charles C and Brewer Laura B
Purchase Details
Closed on
Apr 12, 2013
Sold by
Langerud Christopher B and Langerud Susan
Bought by
Culp Austin and Culp Elaine P
Purchase Details
Closed on
Jan 28, 2008
Sold by
Deck Lee R
Bought by
Royal Lepage Relocation Services Interna
Create a Home Valuation Report for This Property
The Home Valuation Report is an in-depth analysis detailing your home's value as well as a comparison with similar homes in the area
Home Values in the Area
Average Home Value in this Area
Purchase History
| Date | Buyer | Sale Price | Title Company |
|---|---|---|---|
| Erber Curtis N | $102,900 | Fm Title | |
| Brewer Charles C | $70,500 | 9 Title Co | |
| Culp Austin | $68,300 | Title Co | |
| Royal Lepage Relocation Services Interna | -- | -- |
Source: Public Records
Mortgage History
| Date | Status | Borrower | Loan Amount |
|---|---|---|---|
| Open | Erber Curtis N | $874,656 |
Source: Public Records
Tax History Compared to Growth
Tax History
| Year | Tax Paid | Tax Assessment Tax Assessment Total Assessment is a certain percentage of the fair market value that is determined by local assessors to be the total taxable value of land and additions on the property. | Land | Improvement |
|---|---|---|---|---|
| 2024 | $1,600 | $56,400 | $3,500 | $52,900 |
| 2023 | $1,506 | $53,200 | $3,500 | $49,700 |
| 2022 | $1,434 | $49,700 | $3,500 | $46,200 |
| 2021 | $1,535 | $54,400 | $2,750 | $51,650 |
| 2020 | $1,352 | $48,150 | $2,750 | $45,400 |
| 2019 | $1,280 | $45,000 | $1,700 | $43,300 |
| 2018 | $1,254 | $45,000 | $1,700 | $43,300 |
| 2017 | $1,208 | $43,700 | $1,700 | $42,000 |
| 2016 | $1,071 | $42,450 | $1,700 | $40,750 |
| 2015 | $1,010 | $38,500 | $1,150 | $37,350 |
| 2014 | $945 | $35,000 | $1,150 | $33,850 |
| 2013 | $919 | $35,000 | $1,150 | $33,850 |
Source: Public Records
Map
Nearby Homes
- 2326 20th Ave S Unit 9
- 2320 20th Ave S Unit 7
- 1737 Park Blvd S
- 1943 19th St S
- 1725 Whitestone Cir S
- 2301 23rd Ave S
- 1917 16 1 2 St S
- 2402 18th St S Unit 3
- 2202 15th Ave S
- 2402 N Flickertail Dr S Unit 1
- 2419 25 1 2 Ave S Unit 205
- 2507 25th St S Unit 201K
- 2535 25th St S Unit 203
- 2535 25th St S Unit 204B
- 21 Birch Ln S
- 1718 15th St S
- 1543 25th Ave S
- 1834 14 1 2 St S
- 1545 15th St S
- 2801 26th Ave S
- 2012 Park Blvd S Unit B8
- 2012 Park Blvd S Unit B7
- 2012 Park Blvd S Unit B6
- 2012 Park Blvd S Unit B5
- 2012 Park Blvd S Unit B4
- 2012 Park Blvd S Unit B3
- 2012 Park Blvd S Unit B2
- 2012 Park Blvd S
- 2012 Park Blvd S Unit 3
- 2012 Park Blvd S Unit 1
- 2012 Park Blvd S
- 2012 Park Blvd S Unit 6
- 2012 Park Blvd S Unit 4
- 2012 Park Blvd S Unit 2
- 2012 Park Blvd S Unit 5
- 2374 20th Ave S Unit A8
- 2374 20th Ave S Unit A7
- 2374 20th Ave S Unit A6
- 2374 20th Ave S Unit A5
- 2374 20th Ave S Unit A4