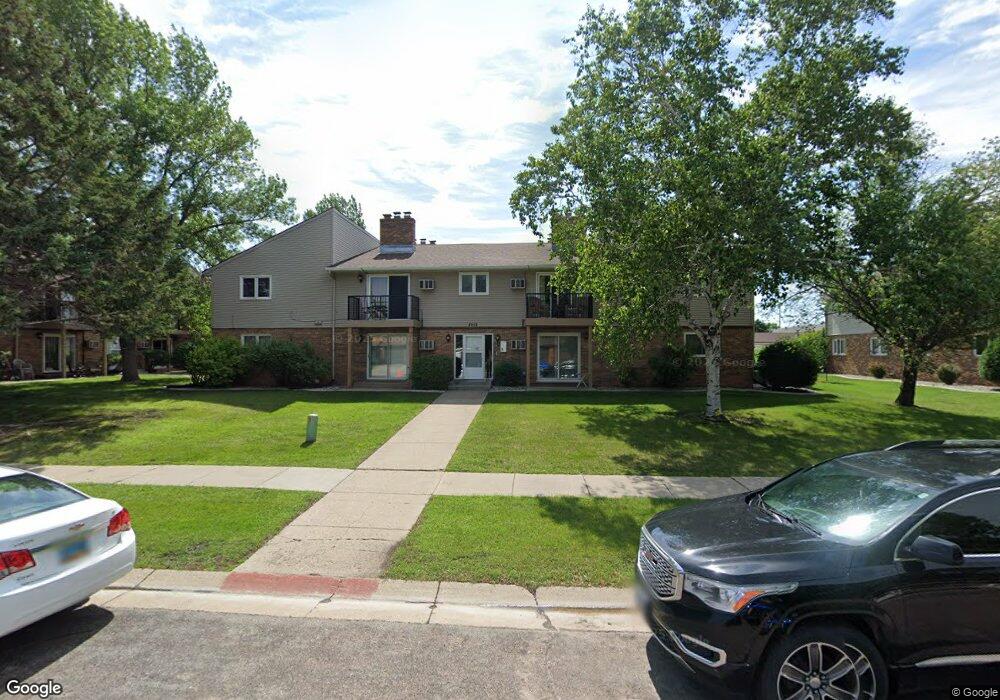
2012 Park Blvd S Unit B8 Fargo, ND 58103
South High NeighborhoodEstimated Value: $120,000 - $141,000
2
Beds
1
Bath
864
Sq Ft
$150/Sq Ft
Est. Value
About This Home
This home is located at 2012 Park Blvd S Unit B8, Fargo, ND 58103 and is currently estimated at $129,667, approximately $150 per square foot. 2012 Park Blvd S Unit B8 is a home located in Cass County with nearby schools including Lewis & Clark Elementary School, Carl Ben Eielson Middle School, and South High School.
Ownership History
Date
Name
Owned For
Owner Type
Purchase Details
Closed on
Oct 24, 2014
Sold by
Brannan Kathryn J and Brannan Joseph A
Bought by
Halverson Barbara J
Current Estimated Value
Purchase Details
Closed on
Feb 10, 2010
Sold by
Reveling Jeffrey C and Reveling Michael D
Bought by
Reveling Kathryn J
Purchase Details
Closed on
Sep 11, 2008
Sold by
Reveling Jeffrey C
Bought by
Reveling Kathry J and Reveling Jeffrey C
Create a Home Valuation Report for This Property
The Home Valuation Report is an in-depth analysis detailing your home's value as well as a comparison with similar homes in the area
Home Values in the Area
Average Home Value in this Area
Purchase History
| Date | Buyer | Sale Price | Title Company |
|---|---|---|---|
| Halverson Barbara J | $200,000 | Fm Title | |
| Reveling Kathryn J | -- | -- | |
| Reveling Kathry J | -- | -- |
Source: Public Records
Tax History Compared to Growth
Tax History
| Year | Tax Paid | Tax Assessment Tax Assessment Total Assessment is a certain percentage of the fair market value that is determined by local assessors to be the total taxable value of land and additions on the property. | Land | Improvement |
|---|---|---|---|---|
| 2024 | $1,108 | $56,400 | $3,500 | $52,900 |
| 2023 | $1,515 | $53,200 | $3,500 | $49,700 |
| 2022 | $1,442 | $49,700 | $3,500 | $46,200 |
| 2021 | $1,543 | $54,400 | $2,750 | $51,650 |
| 2020 | $1,360 | $48,150 | $2,750 | $45,400 |
| 2019 | $1,288 | $45,000 | $1,700 | $43,300 |
| 2018 | $1,263 | $45,000 | $1,700 | $43,300 |
| 2017 | $1,217 | $43,700 | $1,700 | $42,000 |
| 2016 | $1,080 | $42,450 | $1,700 | $40,750 |
| 2015 | $1,019 | $38,500 | $1,150 | $37,350 |
| 2014 | $953 | $35,000 | $1,150 | $33,850 |
| 2013 | $927 | $35,000 | $1,150 | $33,850 |
Source: Public Records
Map
Nearby Homes
- 2326 20th Ave S Unit 9
- 2320 20th Ave S Unit 7
- 1737 Park Blvd S
- 1943 19th St S
- 1725 Whitestone Cir S
- 2301 23rd Ave S
- 1917 16 1 2 St S
- 2402 18th St S Unit 3
- 2202 15th Ave S
- 2402 N Flickertail Dr S Unit 1
- 2419 25 1 2 Ave S Unit 205
- 2507 25th St S Unit 201K
- 2535 25th St S Unit 203
- 2535 25th St S Unit 204B
- 21 Birch Ln S
- 1718 15th St S
- 1543 25th Ave S
- 1834 14 1 2 St S
- 1545 15th St S
- 2801 26th Ave S
- 2012 Park Blvd S Unit B7
- 2012 Park Blvd S Unit B6
- 2012 Park Blvd S Unit B5
- 2012 Park Blvd S Unit B4
- 2012 Park Blvd S Unit B3
- 2012 Park Blvd S Unit B2
- 2012 Park Blvd S
- 2012 Park Blvd S Unit 3
- 2012 Park Blvd S Unit 1
- 2012 Park Blvd S
- 2012 Park Blvd S Unit 6
- 2012 Park Blvd S Unit 4
- 2012 Park Blvd S Unit 7
- 2012 Park Blvd S Unit 2
- 2012 Park Blvd S Unit 5
- 2374 20th Ave S Unit A8
- 2374 20th Ave S Unit A7
- 2374 20th Ave S Unit A6
- 2374 20th Ave S Unit A5
- 2374 20th Ave S Unit A4