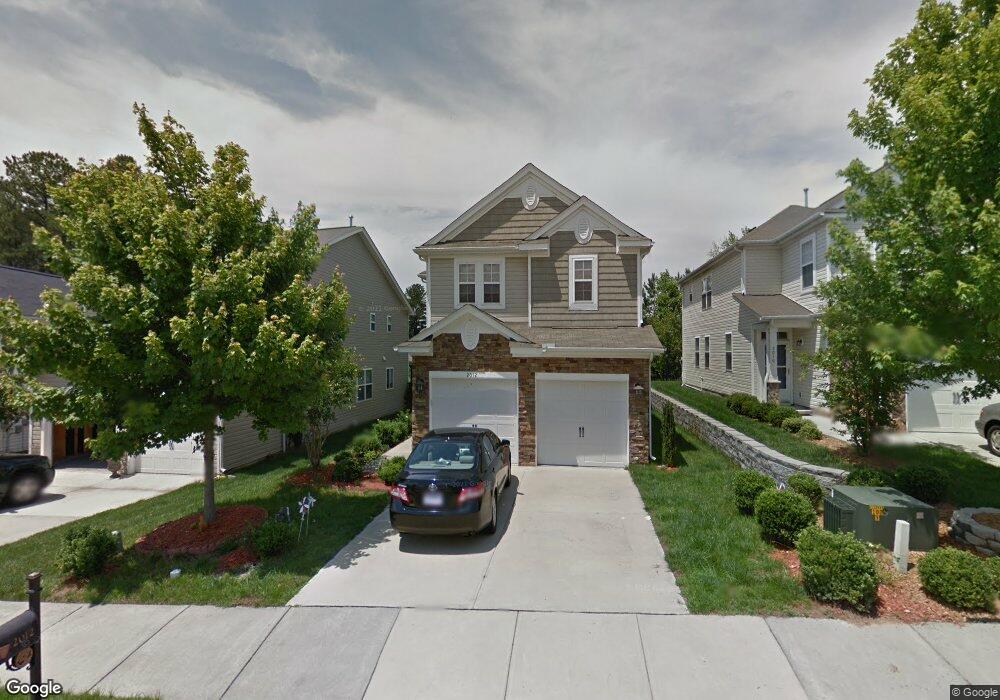
2012 Remington Oaks Cir Cary, NC 27519
Cary Park NeighborhoodEstimated Value: $569,000 - $597,239
4
Beds
3
Baths
2,126
Sq Ft
$273/Sq Ft
Est. Value
About This Home
This home is located at 2012 Remington Oaks Cir, Cary, NC 27519 and is currently estimated at $581,310, approximately $273 per square foot. 2012 Remington Oaks Cir is a home located in Wake County with nearby schools including Hortons Creek Elementary, Mills Park Middle School, and Panther Creek High School.
Ownership History
Date
Name
Owned For
Owner Type
Purchase Details
Closed on
Dec 5, 2017
Sold by
Reddi Venkateswara Rao
Bought by
Vissanraju Krishna Sudha and Avula Rupesh Reddy
Current Estimated Value
Home Financials for this Owner
Home Financials are based on the most recent Mortgage that was taken out on this home.
Original Mortgage
$244,000
Outstanding Balance
$205,107
Interest Rate
3.88%
Mortgage Type
New Conventional
Estimated Equity
$376,203
Purchase Details
Closed on
Feb 21, 2006
Sold by
Kb Home Raleigh Durham Llc
Bought by
Reddi Venkateswara Rao and Reddi Sahithya
Home Financials for this Owner
Home Financials are based on the most recent Mortgage that was taken out on this home.
Original Mortgage
$183,650
Interest Rate
4.87%
Mortgage Type
Fannie Mae Freddie Mac
Create a Home Valuation Report for This Property
The Home Valuation Report is an in-depth analysis detailing your home's value as well as a comparison with similar homes in the area
Home Values in the Area
Average Home Value in this Area
Purchase History
| Date | Buyer | Sale Price | Title Company |
|---|---|---|---|
| Vissanraju Krishna Sudha | $305,000 | None Available | |
| Reddi Venkateswara Rao | $230,000 | None Available |
Source: Public Records
Mortgage History
| Date | Status | Borrower | Loan Amount |
|---|---|---|---|
| Open | Vissanraju Krishna Sudha | $244,000 | |
| Previous Owner | Reddi Venkateswara Rao | $183,650 |
Source: Public Records
Tax History Compared to Growth
Tax History
| Year | Tax Paid | Tax Assessment Tax Assessment Total Assessment is a certain percentage of the fair market value that is determined by local assessors to be the total taxable value of land and additions on the property. | Land | Improvement |
|---|---|---|---|---|
| 2025 | $4,591 | $533,278 | $209,000 | $324,278 |
| 2024 | $4,492 | $533,278 | $209,000 | $324,278 |
| 2023 | $3,142 | $311,558 | $89,000 | $222,558 |
| 2022 | $3,025 | $311,558 | $89,000 | $222,558 |
| 2021 | $2,964 | $311,558 | $89,000 | $222,558 |
| 2020 | $2,980 | $311,558 | $89,000 | $222,558 |
| 2019 | $2,805 | $260,074 | $89,000 | $171,074 |
| 2018 | $2,632 | $260,074 | $89,000 | $171,074 |
| 2017 | $2,530 | $260,074 | $89,000 | $171,074 |
| 2016 | $2,492 | $260,074 | $89,000 | $171,074 |
| 2015 | -- | $256,137 | $84,000 | $172,137 |
| 2014 | -- | $256,137 | $84,000 | $172,137 |
Source: Public Records
Map
Nearby Homes
- 520 Camden Yards Way
- 706 Delta Downs Dr
- 1742 Whirlaway Ct
- 1849 Amberly Ledge Way
- 534 Siltstone Place
- 237 Northlands Dr
- 711 Quartz Crystal Place
- 515 Garendon Dr
- 519 Garendon Dr
- 218 Ashdown Forest Ln
- 1121 Brookhill Way
- 202 Oxford Creek Rd
- 113 Beckingham Loop
- 518 Emerald Downs Rd
- 1428 Yates Store Rd
- 102 Elkton Green Ct
- 210 Beckingham Loop
- 227 Beckingham Loop
- 4107 Bluff Oak Dr
- 317 Beckingham Loop
- 2010 Remington Oaks Cir
- 2014 Remington Oaks Cir
- 2016 Remington Oaks Cir
- 2008 Remington Oaks Cir
- 2006 Remington Oaks Cir
- 2018 Remington Oaks Cir
- 2011 Remington Oaks Cir
- 2020 Remington Oaks Cir
- 2013 Remington Oaks Cir
- 2004 Remington Oaks Cir
- 2009 Remington Oaks Cir
- 2015 Remington Oaks Cir
- 2007 Remington Oaks Cir
- 2017 Remington Oaks Cir
- 2022 Remington Oaks Cir
- 2005 Remington Oaks Cir
- 2002 Remington Oaks Cir
- 2021 Remington Oaks Cir
- 550 War Admiral Ct
- 2003 Remington Oaks Cir