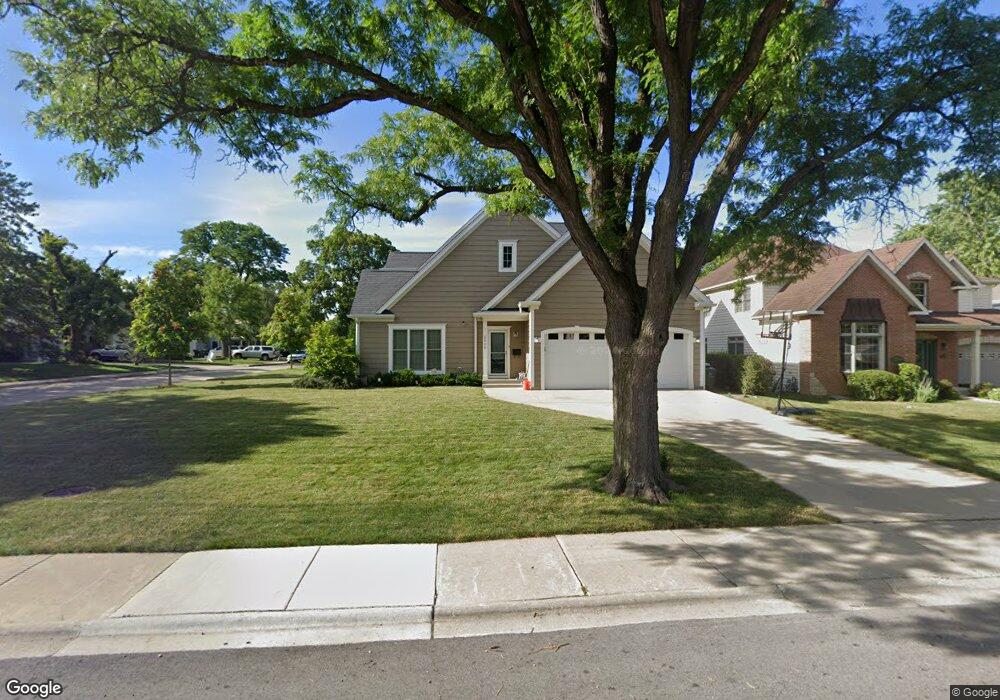
2012 Robincrest Ln Glenview, IL 60025
Estimated Value: $729,000 - $855,739
3
Beds
2
Baths
1,688
Sq Ft
$477/Sq Ft
Est. Value
About This Home
This home is located at 2012 Robincrest Ln, Glenview, IL 60025 and is currently estimated at $805,185, approximately $477 per square foot. 2012 Robincrest Ln is a home located in Cook County with nearby schools including Hoffman Elementary School, Henking Elementary School, and Springman Middle School.
Ownership History
Date
Name
Owned For
Owner Type
Purchase Details
Closed on
Sep 23, 2013
Sold by
Palmberg Scott and Palmberg Michelle
Bought by
Collins Christopher and Lipman Monique
Current Estimated Value
Home Financials for this Owner
Home Financials are based on the most recent Mortgage that was taken out on this home.
Original Mortgage
$335,000
Outstanding Balance
$238,406
Interest Rate
3.5%
Mortgage Type
Adjustable Rate Mortgage/ARM
Estimated Equity
$566,779
Purchase Details
Closed on
Apr 28, 2005
Sold by
Hill Helen M
Bought by
Palmberg Scott and Palmberg Michelle
Home Financials for this Owner
Home Financials are based on the most recent Mortgage that was taken out on this home.
Original Mortgage
$358,000
Interest Rate
4.96%
Mortgage Type
Negative Amortization
Create a Home Valuation Report for This Property
The Home Valuation Report is an in-depth analysis detailing your home's value as well as a comparison with similar homes in the area
Home Values in the Area
Average Home Value in this Area
Purchase History
| Date | Buyer | Sale Price | Title Company |
|---|---|---|---|
| Collins Christopher | $435,000 | Cti | |
| Palmberg Scott | $447,500 | Cti |
Source: Public Records
Mortgage History
| Date | Status | Borrower | Loan Amount |
|---|---|---|---|
| Open | Collins Christopher | $335,000 | |
| Previous Owner | Palmberg Scott | $358,000 | |
| Closed | Palmberg Scott | $44,750 |
Source: Public Records
Tax History
| Year | Tax Paid | Tax Assessment Tax Assessment Total Assessment is a certain percentage of the fair market value that is determined by local assessors to be the total taxable value of land and additions on the property. | Land | Improvement |
|---|---|---|---|---|
| 2025 | $12,768 | $60,000 | $18,886 | $41,114 |
| 2024 | $12,768 | $61,000 | $15,904 | $45,096 |
| 2023 | $12,385 | $61,000 | $15,904 | $45,096 |
| 2022 | $12,385 | $61,000 | $15,904 | $45,096 |
| 2021 | $8,673 | $38,175 | $12,176 | $25,999 |
| 2020 | $8,626 | $38,175 | $12,176 | $25,999 |
| 2019 | $8,035 | $41,951 | $12,176 | $29,775 |
| 2018 | $9,308 | $43,905 | $10,685 | $33,220 |
| 2017 | $9,073 | $43,905 | $10,685 | $33,220 |
| 2016 | $8,759 | $43,905 | $10,685 | $33,220 |
| 2015 | $7,840 | $35,545 | $8,697 | $26,848 |
| 2014 | $7,709 | $35,545 | $8,697 | $26,848 |
| 2013 | $7,460 | $35,545 | $8,697 | $26,848 |
Source: Public Records
Map
Nearby Homes
- 2009 Robincrest Ln
- 625 Wissing Ln
- 517 Briarhill Ln
- 440 Briarhill Rd
- 1777 Dewes St Unit E
- 1730 George Ct
- 706 Waukegan Rd Unit 4
- 1800 Dewes St Unit 310
- 245 Nora Ave
- 311 Neva Ave
- 1853 Prairie St Unit A4
- 609 Carriage Hill Dr
- 2238 Prairie St
- 2537 Pick Dr
- 711 Carriage Hill Dr
- 124 Harlem Ave
- 1088 Shermer Rd Unit DW
- 38 Washington St
- 1621 Glenview Rd Unit 225
- 1625 Glenview Rd Unit 103
- 2006 Robincrest Ln
- 2000 Robincrest Ln
- 645 Lincoln St
- 2007 Palmgren Dr Unit 2
- 632 Lincoln St
- 2022 Robincrest Ln
- 638 Lincoln St
- 2001 Palmgren Dr
- 1966 Robincrest Ln
- 2013 Robincrest Ln
- 2015 Robincrest Ln
- 644 Lincoln St
- 1969 Palmgren Dr
- 2025 Robincrest Ln
- 1964 Robincrest Ln
- 648 Lincoln St Unit 2
- 2029 Robincrest Ln
- 1965 Palmgren Dr
- 631 Garden Ct
Your Personal Tour Guide
Ask me questions while you tour the home.