
Seller's Agent in 2017
KATIE HUGHEY GATEWOOD
Hughey & Neuman, Inc.
(229) 881-0743
23 in this area
249 Total Sales
Estimated Value: $181,000 - $215,000
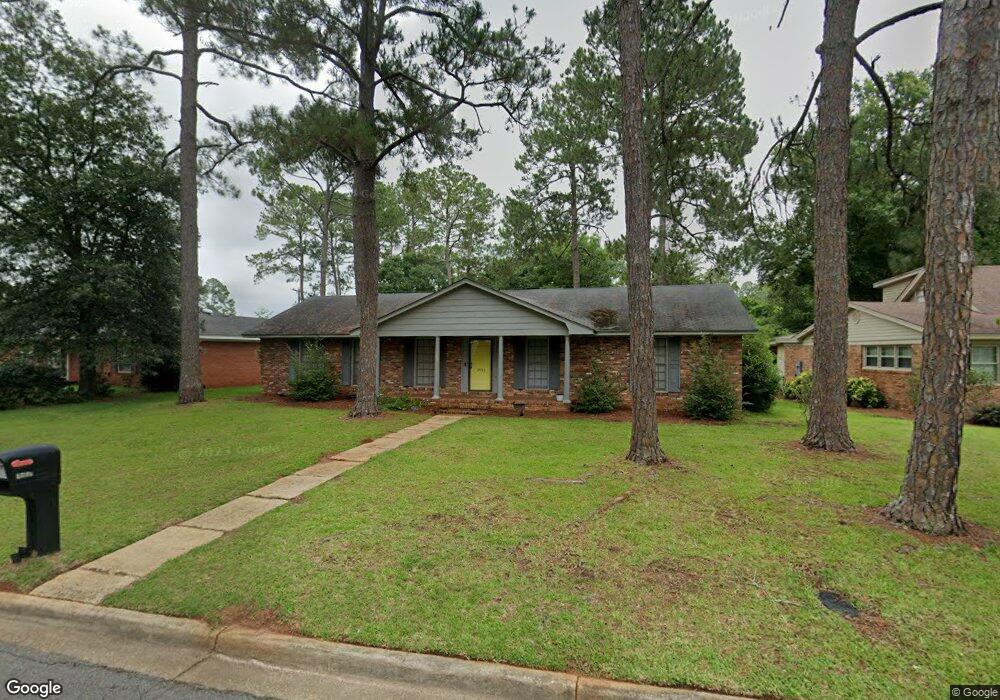
LAKE PARK LOOKERS!! Charming and updated home in Lake Park School District. TOP 10 FEATURES! (1) UPDATED & OPEN floor plan between the kitchen and den enhances quality family time and features a custom island! (2) Hardwood floors & tile floor in kitchen and den 3 + Updated Light Fixtures (3) Beautiful Master Bedroom w/ Updated Master Bath Bath w/ walk-in Tile Shower 4) Large Laundry w/ Custom Cubbies/ Mud Area and Pantry! 5) Den with built-ins, cabinetry for storage, desk area & French doors leading to the deck overlooking the backyard 6.) Outside you will find a fenced yard, Firepit Area, Dog Kennel, Large Double Carport & 2 Storage Buildings (7) Alarm system (8) Updated Exterior Paint (9) All Kitchen appliances included! 10.) Within walking distance to several schools, playgrounds, medical, and churches in the area! Call TODAY!
| Date | Buyer | Sale Price | Title Company |
|---|---|---|---|
| Mullen Devin S | $119,500 | -- | |
| Lorber Christine H | -- | -- | |
| Lorber Christine | $65,000 | -- | |
| Lorber Christine | $65,000 | -- | |
| Gajdostik Joseph A | -- | -- |
| Date | Status | Borrower | Loan Amount |
|---|---|---|---|
| Open | Mullen Devin S | $107,550 | |
| Previous Owner | Lorber Christine H | $118,373 | |
| Previous Owner | Lorber Christine | $127,991 |
| Date | Event | Price | List to Sale | Price per Sq Ft | Prior Sale |
|---|---|---|---|---|---|
| 07/31/2017 07/31/17 | Sold | $119,500 | -- | $65 / Sq Ft | View Prior Sale |
| 05/25/2017 05/25/17 | Pending | -- | -- | -- |
| Year | Tax Paid | Tax Assessment Tax Assessment Total Assessment is a certain percentage of the fair market value that is determined by local assessors to be the total taxable value of land and additions on the property. | Land | Improvement |
|---|---|---|---|---|
| 2024 | $2,198 | $46,080 | $7,080 | $39,000 |
| 2023 | $2,147 | $46,080 | $7,080 | $39,000 |
| 2022 | $2,155 | $46,080 | $7,080 | $39,000 |
| 2021 | $1,998 | $46,080 | $7,080 | $39,000 |
| 2020 | $2,002 | $46,080 | $7,080 | $39,000 |
| 2019 | $2,019 | $46,080 | $7,080 | $39,000 |
| 2018 | $0 | $46,080 | $7,080 | $39,000 |
| 2017 | $1,799 | $46,080 | $7,080 | $39,000 |
| 2016 | $1,800 | $46,080 | $7,080 | $39,000 |
| 2015 | $1,805 | $46,080 | $7,080 | $39,000 |
| 2014 | $1,936 | $47,880 | $8,880 | $39,000 |
Seller's Agent in 2017
KATIE HUGHEY GATEWOOD
Hughey & Neuman, Inc.
(229) 881-0743
23 in this area
249 Total Sales
K
Buyer's Agent in 2017
KYLA STANDRING
Era All In One Realty
(229) 809-0494
17 Total Sales