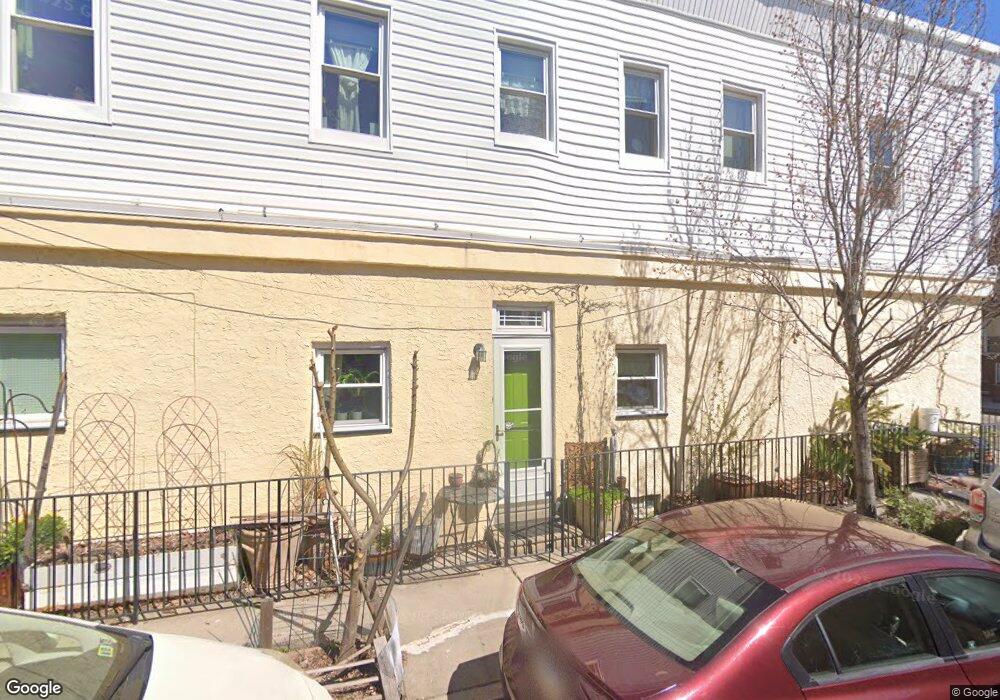
2012 S 3rd St Philadelphia, PA 19148
Pennsport NeighborhoodEstimated Value: $325,000 - $410,000
3
Beds
2
Baths
1,728
Sq Ft
$211/Sq Ft
Est. Value
About This Home
This home is located at 2012 S 3rd St, Philadelphia, PA 19148 and is currently estimated at $364,495, approximately $210 per square foot. 2012 S 3rd St is a home located in Philadelphia County with nearby schools including George W. Sharswood School and Furness Horace High School.
Ownership History
Date
Name
Owned For
Owner Type
Purchase Details
Closed on
May 28, 2002
Sold by
Emily St Llc
Bought by
Parlade Ani K
Current Estimated Value
Home Financials for this Owner
Home Financials are based on the most recent Mortgage that was taken out on this home.
Original Mortgage
$136,000
Outstanding Balance
$57,869
Interest Rate
6.9%
Estimated Equity
$306,626
Purchase Details
Closed on
Jun 19, 2001
Sold by
Gargano Victor T
Bought by
Emily St Llc
Purchase Details
Closed on
May 30, 2001
Sold by
Vonsteuben Janice
Bought by
Gargano Victor T
Create a Home Valuation Report for This Property
The Home Valuation Report is an in-depth analysis detailing your home's value as well as a comparison with similar homes in the area
Home Values in the Area
Average Home Value in this Area
Purchase History
| Date | Buyer | Sale Price | Title Company |
|---|---|---|---|
| Parlade Ani K | $170,000 | First American Title Ins Co | |
| Emily St Llc | $28,000 | -- | |
| Gargano Victor T | $20,000 | -- |
Source: Public Records
Mortgage History
| Date | Status | Borrower | Loan Amount |
|---|---|---|---|
| Open | Parlade Ani K | $136,000 |
Source: Public Records
Tax History Compared to Growth
Tax History
| Year | Tax Paid | Tax Assessment Tax Assessment Total Assessment is a certain percentage of the fair market value that is determined by local assessors to be the total taxable value of land and additions on the property. | Land | Improvement |
|---|---|---|---|---|
| 2025 | $1,365 | $319,500 | $63,900 | $255,600 |
| 2024 | $1,365 | $319,500 | $63,900 | $255,600 |
| 2023 | $1,365 | $269,500 | $53,900 | $215,600 |
| 2022 | $1,365 | $97,500 | $53,900 | $43,600 |
| 2021 | $1,365 | $0 | $0 | $0 |
| 2020 | $1,365 | $0 | $0 | $0 |
| 2019 | $1,365 | $0 | $0 | $0 |
| 2018 | $1,365 | $0 | $0 | $0 |
| 2017 | $1,365 | $0 | $0 | $0 |
| 2016 | $1,365 | $0 | $0 | $0 |
| 2015 | -- | $0 | $0 | $0 |
| 2014 | -- | $199,900 | $16,576 | $183,324 |
| 2012 | -- | $10,400 | $1,728 | $8,672 |
Source: Public Records
Map
Nearby Homes
- 2038 S 2nd St
- 327 Winton St
- 1923 S Galloway St
- 2000 E Moyamensing Ave
- 2031 S 4th St
- 138 Mercy St
- 1932 E Moyamensing Ave
- 2149 S 3rd St
- 367 Winton St
- 116 Emily St
- 206 Mifflin St
- 357 Jackson St
- 419 Mercy St
- 334 Jackson St
- 220 Jackson St
- 419 Emily St
- 129 Dudley St
- 416 Dudley St
- 439 Mercy St
- 430 Mckean St