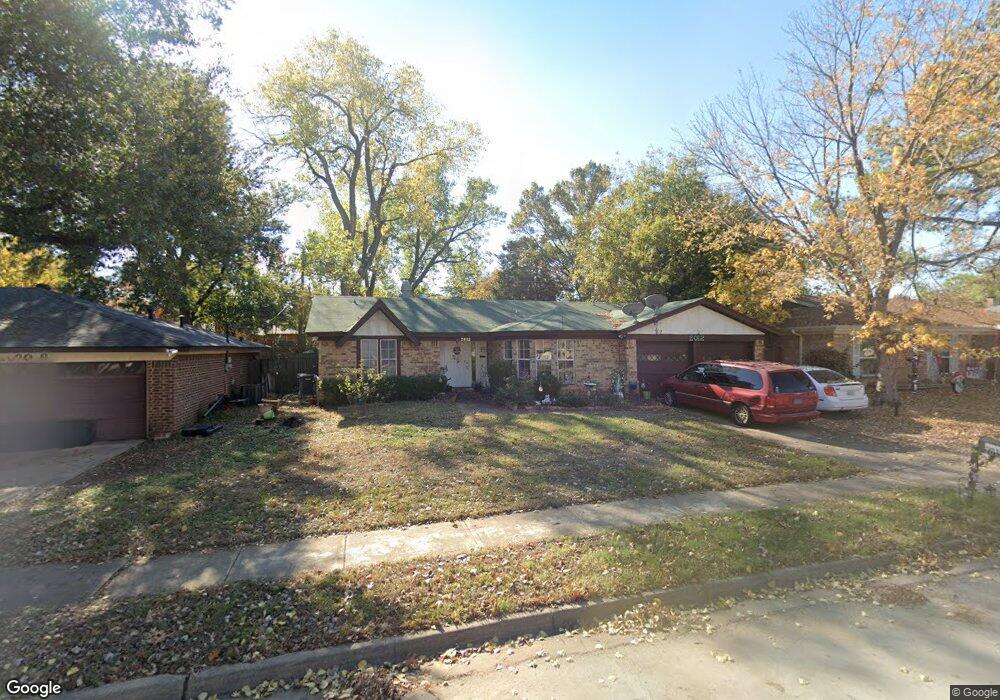
2012 Schumac Ln Bedford, TX 76022
Estimated Value: $309,000 - $334,000
3
Beds
2
Baths
1,423
Sq Ft
$226/Sq Ft
Est. Value
About This Home
This home is located at 2012 Schumac Ln, Bedford, TX 76022 and is currently estimated at $321,015, approximately $225 per square foot. 2012 Schumac Ln is a home located in Tarrant County with nearby schools including Bell Manor Elementary School, Central J High School, and Trinity High School.
Ownership History
Date
Name
Owned For
Owner Type
Purchase Details
Closed on
Mar 29, 2006
Sold by
Higbie Theodore S and Higbie Christine A
Bought by
Bonus Leonardo T and Bonus Marietta Perez
Current Estimated Value
Home Financials for this Owner
Home Financials are based on the most recent Mortgage that was taken out on this home.
Original Mortgage
$113,050
Outstanding Balance
$63,793
Interest Rate
6.24%
Mortgage Type
Fannie Mae Freddie Mac
Estimated Equity
$257,222
Purchase Details
Closed on
Mar 5, 1996
Sold by
Higbie Jo An
Bought by
Higbie Theodore S and Higbie Christine A
Purchase Details
Closed on
Oct 20, 1995
Sold by
Glinski Barbara G
Bought by
Higbie Theodore S and Higbie Christine A
Home Financials for this Owner
Home Financials are based on the most recent Mortgage that was taken out on this home.
Original Mortgage
$67,587
Interest Rate
7.6%
Mortgage Type
FHA
Create a Home Valuation Report for This Property
The Home Valuation Report is an in-depth analysis detailing your home's value as well as a comparison with similar homes in the area
Home Values in the Area
Average Home Value in this Area
Purchase History
| Date | Buyer | Sale Price | Title Company |
|---|---|---|---|
| Bonus Leonardo T | -- | None Available | |
| Higbie Theodore S | -- | Title Escrow Account | |
| Higbie Theodore S | -- | Fidelity National Title Agen |
Source: Public Records
Mortgage History
| Date | Status | Borrower | Loan Amount |
|---|---|---|---|
| Open | Bonus Leonardo T | $113,050 | |
| Previous Owner | Higbie Theodore S | $67,587 |
Source: Public Records
Tax History Compared to Growth
Tax History
| Year | Tax Paid | Tax Assessment Tax Assessment Total Assessment is a certain percentage of the fair market value that is determined by local assessors to be the total taxable value of land and additions on the property. | Land | Improvement |
|---|---|---|---|---|
| 2025 | $881 | $276,206 | $65,000 | $211,206 |
| 2024 | $881 | $276,206 | $65,000 | $211,206 |
| 2023 | $4,819 | $256,315 | $45,000 | $211,315 |
| 2022 | $4,989 | $243,254 | $45,000 | $198,254 |
| 2021 | $4,891 | $207,639 | $45,000 | $162,639 |
| 2020 | $4,511 | $196,899 | $45,000 | $151,899 |
| 2019 | $4,190 | $198,207 | $45,000 | $153,207 |
| 2018 | $1,721 | $156,792 | $23,000 | $133,792 |
| 2017 | $3,448 | $152,046 | $23,000 | $129,046 |
| 2016 | $3,135 | $136,128 | $23,000 | $113,128 |
| 2015 | $1,770 | $117,800 | $18,000 | $99,800 |
| 2014 | $1,770 | $117,800 | $18,000 | $99,800 |
Source: Public Records
Map
Nearby Homes
- 2025 Schumac Ln
- 2201 Greendale Ct
- 1213 Greendale Dr
- 2024 Charleston Dr
- 2101 Gettysburg Place
- 1701 Winchester Way
- 1116 Highpoint Rd
- 1049 Stableway Ln
- 952 Charleston Dr
- 933 Charleston Ct
- 2421 Creek Villas Dr
- 1613 Trinity Ct
- 828 Gregory Ave
- 2428 Chestnut Way
- 804 Natchez Ave
- 2420 Dalewood Ln
- 1604 Richmond Dr
- 808 Gregory Ave
- 1509 Shirley Way
- 800 Prestwick St
- 2008 Schumac Ln
- 2016 Schumac Ln
- 2009 Memphis Dr
- 2020 Schumac Ln
- 2013 Memphis Dr
- 2004 Schumac Ln
- 2005 Memphis Dr
- 2017 Memphis Dr
- 2001 Memphis Dr
- 2013 Schumac Ln
- 2009 Schumac Ln
- 2017 Schumac Ln
- 2024 Schumac Ln
- 2000 Schumac Ln
- 2005 Schumac Ln
- 2021 Schumac Ln
- 2021 Memphis Dr
- 1937 Memphis Dr
- 1936 Schumac Ln
- 2028 Schumac Ln