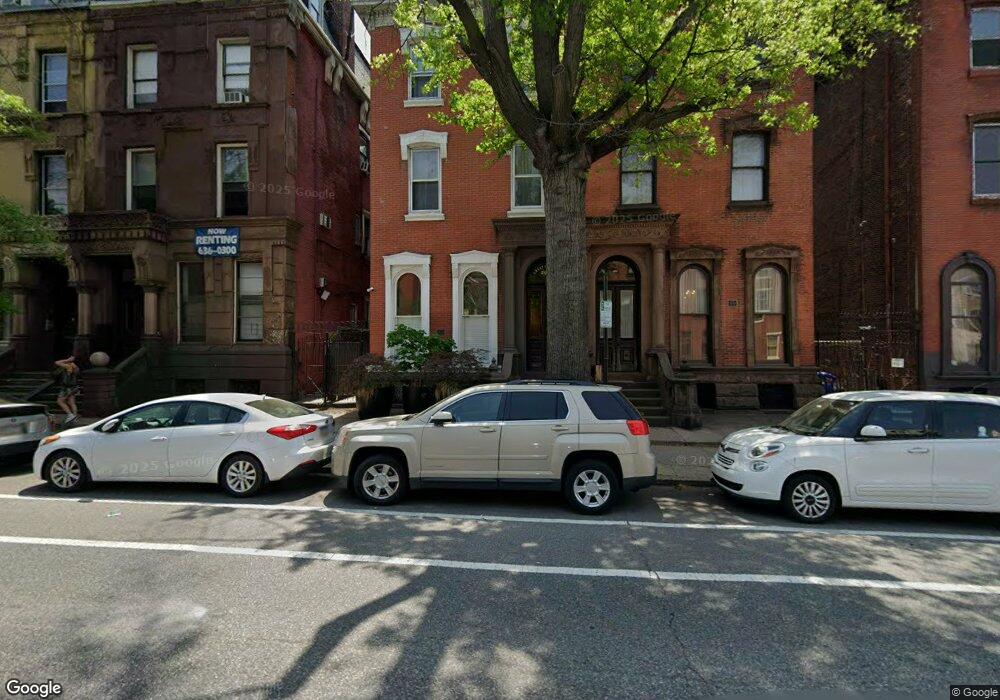
2012 Spring Garden St Unit 2 Philadelphia, PA 19130
Logan Square NeighborhoodEstimated Value: $455,766 - $489,000
2
Beds
2
Baths
1,255
Sq Ft
$377/Sq Ft
Est. Value
About This Home
This home is located at 2012 Spring Garden St Unit 2, Philadelphia, PA 19130 and is currently estimated at $472,942, approximately $376 per square foot. 2012 Spring Garden St Unit 2 is a home located in Philadelphia County with nearby schools including Laura Wheeler Waring Public School, Benjamin Franklin High School, and St Francis Xavier School.
Ownership History
Date
Name
Owned For
Owner Type
Purchase Details
Closed on
Jul 13, 2010
Sold by
Dougherty Tania and Dougherty Christian F
Bought by
Krisberg Barry and Mckie Krisberg Karen
Current Estimated Value
Home Financials for this Owner
Home Financials are based on the most recent Mortgage that was taken out on this home.
Original Mortgage
$340,000
Outstanding Balance
$226,386
Interest Rate
4.76%
Mortgage Type
New Conventional
Estimated Equity
$246,556
Purchase Details
Closed on
Feb 22, 2008
Sold by
Dougherty Christian F
Bought by
Dougherty Christian F and Dougherty Tania
Home Financials for this Owner
Home Financials are based on the most recent Mortgage that was taken out on this home.
Original Mortgage
$396,000
Interest Rate
5.99%
Mortgage Type
New Conventional
Purchase Details
Closed on
Jan 13, 2006
Sold by
Chesterfield Twenty Lp
Bought by
Dougherty Christian F
Home Financials for this Owner
Home Financials are based on the most recent Mortgage that was taken out on this home.
Original Mortgage
$356,700
Interest Rate
6.54%
Mortgage Type
Purchase Money Mortgage
Create a Home Valuation Report for This Property
The Home Valuation Report is an in-depth analysis detailing your home's value as well as a comparison with similar homes in the area
Home Values in the Area
Average Home Value in this Area
Purchase History
| Date | Buyer | Sale Price | Title Company |
|---|---|---|---|
| Krisberg Barry | $425,000 | None Available | |
| Dougherty Christian F | -- | None Available | |
| Dougherty Christian F | $445,876 | None Available |
Source: Public Records
Mortgage History
| Date | Status | Borrower | Loan Amount |
|---|---|---|---|
| Open | Krisberg Barry | $340,000 | |
| Previous Owner | Dougherty Christian F | $396,000 | |
| Previous Owner | Dougherty Christian F | $356,700 |
Source: Public Records
Tax History Compared to Growth
Tax History
| Year | Tax Paid | Tax Assessment Tax Assessment Total Assessment is a certain percentage of the fair market value that is determined by local assessors to be the total taxable value of land and additions on the property. | Land | Improvement |
|---|---|---|---|---|
| 2025 | $5,132 | $384,900 | $57,700 | $327,200 |
| 2024 | $5,132 | $384,900 | $57,700 | $327,200 |
| 2023 | $5,132 | $366,600 | $55,000 | $311,600 |
| 2022 | $4,666 | $366,600 | $55,000 | $311,600 |
| 2021 | $4,666 | $0 | $0 | $0 |
| 2020 | $4,666 | $0 | $0 | $0 |
| 2019 | $4,666 | $0 | $0 | $0 |
| 2018 | $4,666 | $0 | $0 | $0 |
| 2017 | $4,666 | $0 | $0 | $0 |
| 2016 | $4,320 | $0 | $0 | $0 |
| 2015 | $6,763 | $0 | $0 | $0 |
| 2014 | -- | $308,600 | $30,860 | $277,740 |
| 2012 | -- | $101,216 | $2,978 | $98,238 |
Source: Public Records
Map
Nearby Homes
- 2031 Spring Garden St
- 2019 Spring Garden St Unit 3F
- 2001 Hamilton St Unit 1119
- 2001 Hamilton St Unit 1121
- 2001 Hamilton St Unit 1520
- 2001 Hamilton St Unit 1221
- 2001 Hamilton St Unit 723
- 2001 Hamilton St Unit 809
- 2001 Hamilton St Unit 922
- 2001 Hamilton St Unit 507
- 2001 Hamilton St Unit 1621
- 2001 Hamilton St Unit P301
- 2001 Hamilton St Unit 1205
- 2001 Hamilton St Unit 925
- 2001 Hamilton St Unit 1523
- 2001 Hamilton St Unit 1029
- 2001 Hamilton St Unit 401
- 2001 Hamilton St Unit 514
- 2001 Hamilton St Unit 1024
- 1935 Spring Garden St
- 2012 Spring Garden St
- 2012 Spring Garden St Unit 3
- 2012 Spring Garden St Unit 1
- 2014 Spring Garden St
- 2010 Spring Garden St
- 2016 Spring Garden St Unit 3F
- 2016 Spring Garden St
- 2008 Spring Garden St Unit 1R / 2
- 2008 Spring Garden St Unit 1F
- 2008 Spring Garden St Unit 2F
- 2008 Spring Garden St Unit 1R
- 2008 Spring Garden St Unit 3R
- 2008 Spring Garden St Unit 2R
- 2008 Spring Garden St Unit 3F
- 2008 Spring Garden St Unit 6
- 2008 Spring Garden St Unit 5
- 2008 Spring Garden St Unit 4
- 2008 Spring Garden St Unit 3
- 2008 Spring Garden St Unit 2
- 2008 Spring Garden St Unit 1