Estimated Value: $381,000 - $430,000
4
Beds
2
Baths
2,184
Sq Ft
$188/Sq Ft
Est. Value
About This Home
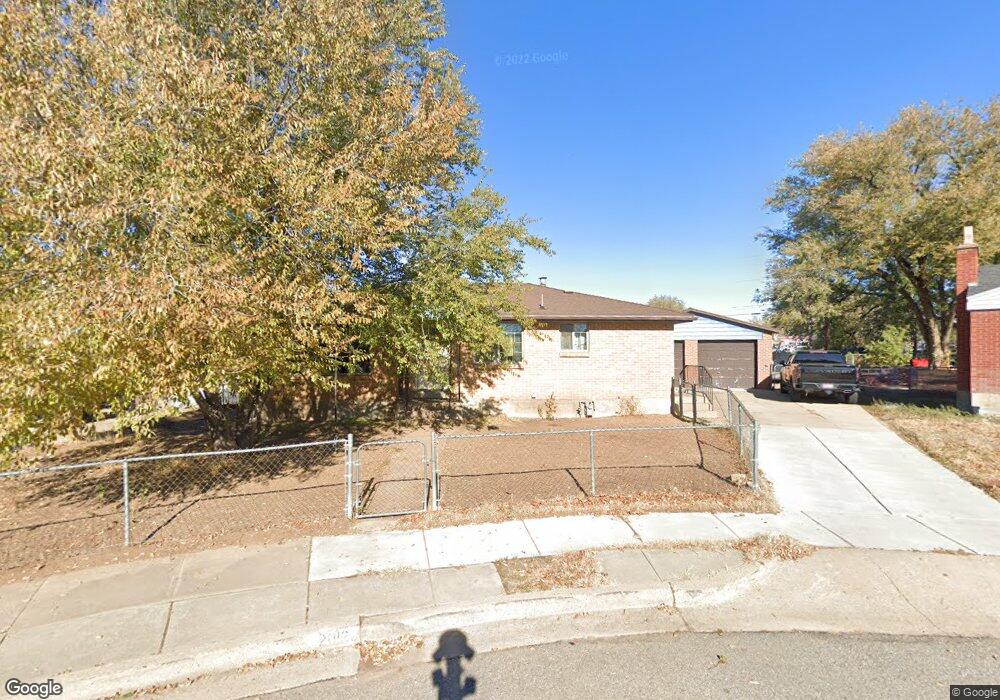
This home is located at 2012 W 6075 S, Roy, UT 84067 and is currently estimated at $410,849, approximately $188 per square foot. 2012 W 6075 S is a home located in Weber County with nearby schools including Municipal School, Roy Junior High School, and Roy High School.
Ownership History
Date
Name
Owned For
Owner Type
Purchase Details
Closed on
Jul 12, 2018
Sold by
Johnston Ashton
Bought by
Macgoldrick Keegan
Current Estimated Value
Purchase Details
Closed on
Sep 5, 2017
Sold by
Beck Brayden and Beck Larae
Bought by
Johnston Ashtob
Home Financials for this Owner
Home Financials are based on the most recent Mortgage that was taken out on this home.
Original Mortgage
$203,250
Interest Rate
4.25%
Mortgage Type
FHA
Purchase Details
Closed on
Dec 28, 2006
Sold by
Myers Betty Jane
Bought by
Myers Betty Jane and Myers Bruce D
Create a Home Valuation Report for This Property
The Home Valuation Report is an in-depth analysis detailing your home's value as well as a comparison with similar homes in the area
Home Values in the Area
Average Home Value in this Area
Purchase History
| Date | Buyer | Sale Price | Title Company |
|---|---|---|---|
| Macgoldrick Keegan | -- | Us Title Insurance Agency | |
| Johnston Ashtob | -- | First American Title | |
| Myers Betty Jane | -- | None Available |
Source: Public Records
Mortgage History
| Date | Status | Borrower | Loan Amount |
|---|---|---|---|
| Previous Owner | Johnston Ashtob | $203,250 |
Source: Public Records
Tax History Compared to Growth
Tax History
| Year | Tax Paid | Tax Assessment Tax Assessment Total Assessment is a certain percentage of the fair market value that is determined by local assessors to be the total taxable value of land and additions on the property. | Land | Improvement |
|---|---|---|---|---|
| 2025 | $2,505 | $392,778 | $127,731 | $265,047 |
| 2024 | $2,461 | $213,947 | $70,260 | $143,687 |
| 2023 | $2,303 | $199,650 | $64,239 | $135,411 |
| 2022 | $2,510 | $226,050 | $55,729 | $170,321 |
| 2021 | $1,975 | $290,000 | $71,154 | $218,846 |
| 2020 | $1,874 | $253,000 | $71,154 | $181,846 |
| 2019 | $1,803 | $229,000 | $40,995 | $188,005 |
| 2018 | $1,738 | $208,000 | $38,976 | $169,024 |
| 2017 | $1,501 | $166,000 | $35,927 | $130,073 |
| 2016 | $1,420 | $84,149 | $17,548 | $66,601 |
| 2015 | $1,253 | $75,160 | $17,548 | $57,612 |
| 2014 | $1,251 | $74,357 | $17,548 | $56,809 |
Source: Public Records
Map
Nearby Homes
- 2622 N 175 W
- 2622 2125 W
- 2632 2125 W
- 244 W 2575 N
- 5902 S 1900 W
- 350 W 2575 N
- 389 W 2575 N
- 428 W 2650 N
- 480 W 2650 N
- 484 W 2650 N
- 2512 N 475 W
- 2635 N 500 W Unit 45
- 2593 N 500 W Unit 56
- 2612 N 525 W
- 2486 N 690 W
- 5643 S 2200 W
- 2146 W 5600 S Unit 29
- 2101 N Main St Unit 205
- 2101 N Main St Unit 203
- 2101 N Main St Unit 409