2012 Whooping Creek Rd Carrollton, GA 30116
Estimated Value: $422,000 - $583,300
3
Beds
3
Baths
3,741
Sq Ft
$129/Sq Ft
Est. Value
About This Home
This home is located at 2012 Whooping Creek Rd, Carrollton, GA 30116 and is currently estimated at $482,575, approximately $128 per square foot. 2012 Whooping Creek Rd is a home located in Carroll County with nearby schools including Roopville Elementary School, Central Middle School, and Central High School.
Ownership History
Date
Name
Owned For
Owner Type
Purchase Details
Closed on
May 9, 2014
Sold by
Regions Bank Dba Regions Mortgage
Bought by
Lawson Michael E and Lawson Andrea
Current Estimated Value
Home Financials for this Owner
Home Financials are based on the most recent Mortgage that was taken out on this home.
Original Mortgage
$87,000
Outstanding Balance
$67,801
Interest Rate
4.4%
Mortgage Type
New Conventional
Estimated Equity
$474,565
Purchase Details
Closed on
Sep 1, 2004
Sold by
Lawson Michael E and Lawson Andrea
Bought by
Lawson Michael E and Lawson Andrea
Purchase Details
Closed on
May 22, 2002
Sold by
Lawson Michael E and Lawson A
Bought by
Lawson Michael E and Lawson Andrea
Purchase Details
Closed on
Mar 29, 1999
Sold by
Tutsch Wilbert
Bought by
Lawson Michael E and Lawson A
Create a Home Valuation Report for This Property
The Home Valuation Report is an in-depth analysis detailing your home's value as well as a comparison with similar homes in the area
Home Values in the Area
Average Home Value in this Area
Purchase History
| Date | Buyer | Sale Price | Title Company |
|---|---|---|---|
| Lawson Michael E | -- | -- | |
| Lawson Michael E | -- | -- | |
| Lawson Michael E | -- | -- | |
| Lawson Michael E | $75,000 | -- |
Source: Public Records
Mortgage History
| Date | Status | Borrower | Loan Amount |
|---|---|---|---|
| Open | Lawson Michael | $87,000 | |
| Previous Owner | Lawson Michael E | $95,000 |
Source: Public Records
Tax History Compared to Growth
Tax History
| Year | Tax Paid | Tax Assessment Tax Assessment Total Assessment is a certain percentage of the fair market value that is determined by local assessors to be the total taxable value of land and additions on the property. | Land | Improvement |
|---|---|---|---|---|
| 2024 | $3,530 | $191,264 | $27,668 | $163,596 |
| 2023 | $3,530 | $172,672 | $22,134 | $150,538 |
| 2022 | $2,880 | $135,555 | $14,756 | $120,799 |
| 2021 | $2,603 | $116,280 | $11,805 | $104,475 |
| 2020 | $2,388 | $104,152 | $10,732 | $93,420 |
| 2019 | $2,275 | $96,978 | $10,732 | $86,246 |
| 2018 | $2,140 | $87,893 | $10,030 | $77,863 |
| 2017 | $2,146 | $87,893 | $10,030 | $77,863 |
| 2016 | $2,147 | $87,893 | $10,030 | $77,863 |
| 2015 | $2,119 | $79,786 | $12,312 | $67,475 |
| 2014 | $2,128 | $79,786 | $12,312 | $67,475 |
Source: Public Records
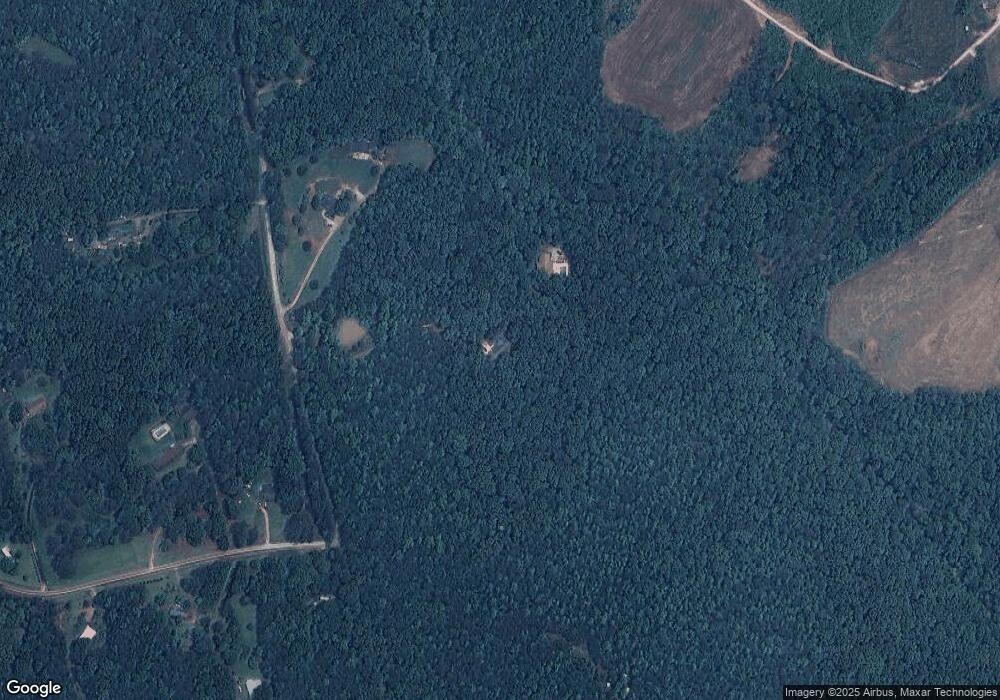
Map
Nearby Homes
- 1430 Whooping Creek Church Rd
- 1450 Whooping Creek Church Rd
- 2237 Clem Lowell Rd
- 1502 Whooping Creek Church Rd
- 1512 Whooping Creek Church Rd
- 1520 Whooping Creek Church Rd
- 500 Coleman Mill Rd
- 1530 Whooping Creek Church Rd
- 1177 Davis Rd
- 000 Davis Rd
- 0 Davis Rd Unit 10580458
- 221 Valley Ridge Dr
- 0 Lowell Rd Unit 10516194
- 415 Gray Rd
- 400 Old Stagecoach Rd
- 922 Shoemake Rd
- 2012 Whooping Creek Rd
- 2002 Whooping Creek Rd
- 2121 Whooping Creek Rd
- 2163 Whooping Creek Rd
- 1995 Whooping Creek Rd
- 1995 Whooping Creek Rd
- 1710 Whooping Creek Rd
- 2160 Whooping Creek Rd
- 2197 Whooping Creek Rd
- 2140 Whooping Creek Rd
- 60 Howard Rd
- 1837 Whooping Creek Rd
- 2229 Whooping Creek Rd
- 25 Howard Rd
- 2222 Whooping Creek Rd
- 1481 Clem Lowell Rd
- 1447 Clem Lowell Rd
- 2271 Whooping Creek Rd
- 75 Howard Rd
- 2254 Whooping Creek Rd