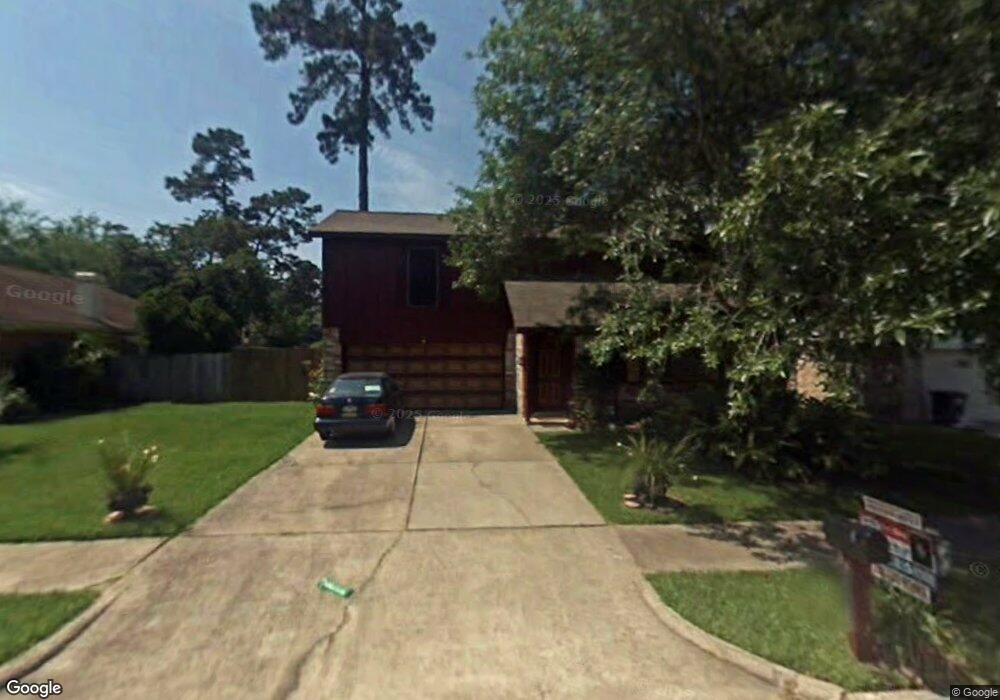
20125 Misty Pines Dr Humble, TX 77346
Estimated Value: $213,892 - $235,000
3
Beds
3
Baths
1,617
Sq Ft
$139/Sq Ft
Est. Value
About This Home
This home is located at 20125 Misty Pines Dr, Humble, TX 77346 and is currently estimated at $224,223, approximately $138 per square foot. 20125 Misty Pines Dr is a home located in Harris County with nearby schools including Oaks Elementary School, Timberwood Middle School, and Atascocita High School.
Ownership History
Date
Name
Owned For
Owner Type
Purchase Details
Closed on
Feb 26, 2014
Sold by
Srp Sub Llc
Bought by
Tarbert Llc
Current Estimated Value
Purchase Details
Closed on
May 7, 2013
Sold by
Cook Richard S
Bought by
Srp Sub Llc
Purchase Details
Closed on
Aug 20, 2008
Sold by
Brandon Jeffery
Bought by
Cook Richard S
Home Financials for this Owner
Home Financials are based on the most recent Mortgage that was taken out on this home.
Original Mortgage
$97,864
Interest Rate
6.42%
Mortgage Type
FHA
Purchase Details
Closed on
May 19, 1999
Sold by
Wilson Gene R and Wilson Patti M
Bought by
Brandon Jeffery
Home Financials for this Owner
Home Financials are based on the most recent Mortgage that was taken out on this home.
Original Mortgage
$65,140
Interest Rate
6.89%
Mortgage Type
FHA
Create a Home Valuation Report for This Property
The Home Valuation Report is an in-depth analysis detailing your home's value as well as a comparison with similar homes in the area
Home Values in the Area
Average Home Value in this Area
Purchase History
| Date | Buyer | Sale Price | Title Company |
|---|---|---|---|
| Tarbert Llc | -- | -- | |
| Tarbert Llc | -- | -- | |
| Srp Sub Llc | -- | None Available | |
| Cook Richard S | -- | First American Title | |
| Brandon Jeffery | -- | First American Title |
Source: Public Records
Mortgage History
| Date | Status | Borrower | Loan Amount |
|---|---|---|---|
| Previous Owner | Cook Richard S | $97,864 | |
| Previous Owner | Brandon Jeffery | $65,140 | |
| Closed | Brandon Jeffery | $3,500 |
Source: Public Records
Tax History Compared to Growth
Tax History
| Year | Tax Paid | Tax Assessment Tax Assessment Total Assessment is a certain percentage of the fair market value that is determined by local assessors to be the total taxable value of land and additions on the property. | Land | Improvement |
|---|---|---|---|---|
| 2025 | $4,729 | $167,787 | $25,600 | $142,187 |
| 2024 | $4,729 | $200,661 | $25,600 | $175,061 |
| 2023 | $4,729 | $200,661 | $25,600 | $175,061 |
| 2022 | $4,190 | $167,172 | $25,600 | $141,572 |
| 2021 | $3,946 | $151,024 | $25,600 | $125,424 |
| 2020 | $3,594 | $140,300 | $25,600 | $114,700 |
| 2019 | $3,623 | $127,791 | $17,067 | $110,724 |
| 2018 | $1,668 | $109,764 | $14,510 | $95,254 |
| 2017 | $3,143 | $109,764 | $14,510 | $95,254 |
| 2016 | $3,184 | $111,200 | $14,510 | $96,690 |
| 2015 | $1,881 | $95,000 | $14,510 | $80,490 |
| 2014 | $1,881 | $94,499 | $14,510 | $79,989 |
Source: Public Records
Map
Nearby Homes
- 109 Kings Lake Estates Blvd
- 105 Kings Lake Estates Blvd
- 20109 Misty Pines Dr
- 113 Kings Lake Estates Blvd
- 20113 Dawn Mist Dr
- 20207 Misty Pines Dr
- 121 Kings Lake Estates Blvd
- 73 Kings Lake Estates Blvd
- 69 Kings Lake Estates Blvd
- 5443 Quail Tree Ln
- 20022 River Brook Dr
- 20011 Dawn Mist Dr
- 141 Kings Lake Estates Blvd
- 20018 Big Timber Dr
- 19919 Burle Oak Dr
- 20107 Bambiwoods Dr
- 5303 Quail Tree Ln
- 19922 Big Timber Dr
- 19914 Big Timber Dr
- 19823 Burle Oak Dr
- 20129 Misty Pines Dr
- 20121 Misty Pines Dr
- 20126 Dawn Mist Dr
- 20130 Dawn Mist Dr
- 20133 Misty Pines Dr
- 20117 Misty Pines Dr
- 20122 Dawn Mist Dr
- 20134 Dawn Mist Dr
- 20122 Misty Pines Dr
- 20118 Misty Pines
- 20118 Misty Pines Dr
- 20126 Misty Pines Dr
- 20114 Misty Pines
- 20118 Dawn Mist Dr
- 20137 Misty Pines Dr
- 20138 Dawn Mist Dr
- 20113 Misty Pines Dr
- 20130 Misty Pines Dr
- 20114 Misty Pines Dr
- 20114 Dawn Mist Dr