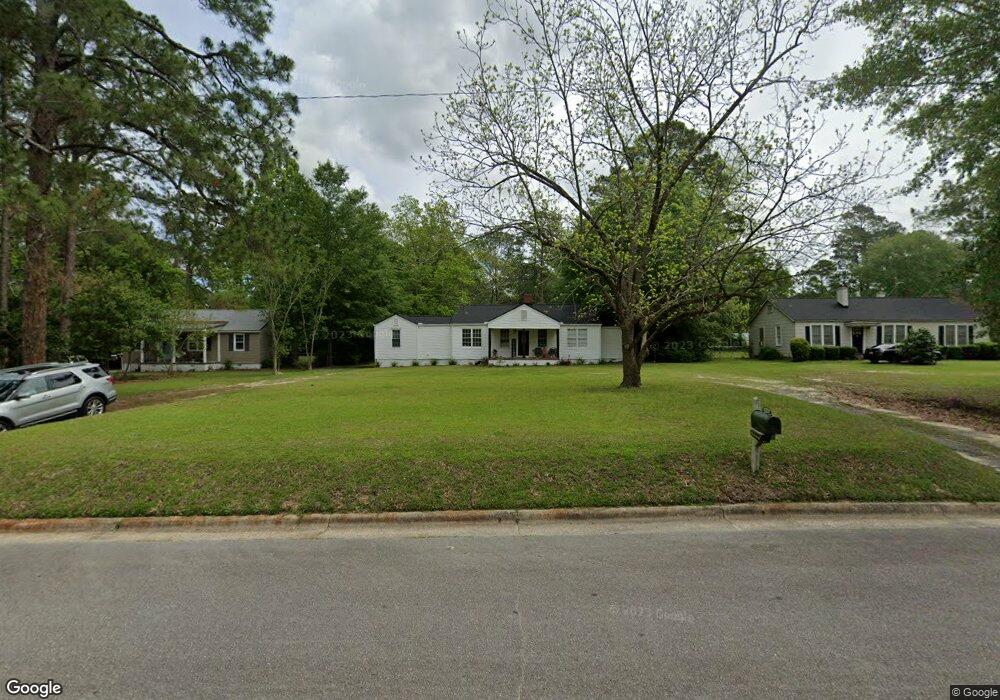
2013 2nd St SE Moultrie, GA 31768
Estimated Value: $200,000 - $210,215
--
Bed
2
Baths
1,384
Sq Ft
$147/Sq Ft
Est. Value
About This Home
This home is located at 2013 2nd St SE, Moultrie, GA 31768 and is currently estimated at $204,054, approximately $147 per square foot. 2013 2nd St SE is a home located in Colquitt County with nearby schools including Wright Elementary School, Willie J. Williams Middle School, and C.A. Gray Junior High School.
Ownership History
Date
Name
Owned For
Owner Type
Purchase Details
Closed on
Apr 29, 2022
Sold by
Murphy Justin Brian
Bought by
Tillman Robyn E
Current Estimated Value
Home Financials for this Owner
Home Financials are based on the most recent Mortgage that was taken out on this home.
Original Mortgage
$192,449
Outstanding Balance
$183,224
Interest Rate
5.5%
Mortgage Type
FHA
Estimated Equity
$20,830
Purchase Details
Closed on
Nov 30, 2021
Sold by
Reynolds Julie D
Bought by
Murphy Justin Brian
Home Financials for this Owner
Home Financials are based on the most recent Mortgage that was taken out on this home.
Original Mortgage
$89,250
Interest Rate
3.09%
Mortgage Type
Commercial
Purchase Details
Closed on
Jun 11, 2018
Sold by
Henagen Billy R
Bought by
Reynolds Julie D
Purchase Details
Closed on
Sep 1, 1999
Bought by
Henagen Billy R
Purchase Details
Closed on
Dec 31, 1991
Bought by
Byrd Jack D
Create a Home Valuation Report for This Property
The Home Valuation Report is an in-depth analysis detailing your home's value as well as a comparison with similar homes in the area
Home Values in the Area
Average Home Value in this Area
Purchase History
| Date | Buyer | Sale Price | Title Company |
|---|---|---|---|
| Tillman Robyn E | $196,000 | -- | |
| Murphy Justin Brian | $105,000 | -- | |
| Reynolds Julie D | -- | -- | |
| Henagen Billy R | $66,000 | -- | |
| Byrd Jack D | $40,500 | -- |
Source: Public Records
Mortgage History
| Date | Status | Borrower | Loan Amount |
|---|---|---|---|
| Open | Tillman Robyn E | $192,449 | |
| Previous Owner | Murphy Justin Brian | $89,250 |
Source: Public Records
Tax History Compared to Growth
Tax History
| Year | Tax Paid | Tax Assessment Tax Assessment Total Assessment is a certain percentage of the fair market value that is determined by local assessors to be the total taxable value of land and additions on the property. | Land | Improvement |
|---|---|---|---|---|
| 2024 | $2,649 | $81,977 | $3,000 | $78,977 |
| 2023 | $2,474 | $63,293 | $3,000 | $60,293 |
| 2022 | $1,406 | $54,154 | $3,000 | $51,154 |
| 2021 | $1,182 | $34,843 | $3,000 | $31,843 |
| 2020 | $1,024 | $29,690 | $3,000 | $26,690 |
| 2019 | $1,080 | $27,816 | $3,000 | $24,816 |
| 2018 | $1,086 | $27,194 | $3,000 | $24,194 |
| 2017 | $1,044 | $27,194 | $3,000 | $24,194 |
| 2016 | $1,086 | $27,194 | $3,000 | $24,194 |
| 2015 | $1,089 | $27,194 | $3,000 | $24,194 |
| 2014 | $1,115 | $27,194 | $3,000 | $24,194 |
| 2013 | -- | $27,193 | $3,000 | $24,193 |
Source: Public Records
Map
Nearby Homes
- 2021 S Main St
- 0 Georgia 33
- 1941 S Main St
- 1935 4th St SE
- 1904 5th St SE
- 204 Nandina Dr
- M041 5th St SE
- 304 Tallokas Rd
- 1777 S Main St
- 29 17th Ave SE
- 1712 Villa Dr SW
- 1732 4th St SE
- 1701 10th St SE
- 0 26th Ave SE
- 1546 Ivy Ln
- 7 SE Pheasant Ln
- 210 13th Ave SE
- 1310 S Main St
- 0 Gatewood Cir Unit 1652303
- 424 U S Highway 319