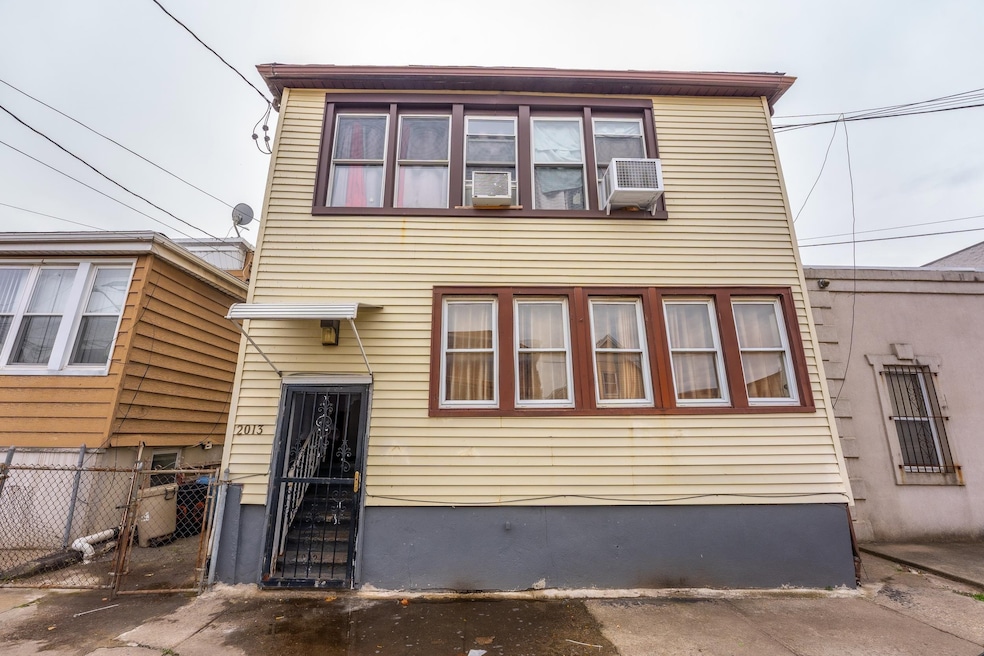


2013 41st St North Bergen, NJ 07047
Estimated payment $4,061/month
About This Home
Income-Producing 2-Family Home – Prime Location! Don't miss this fantastic investment opportunity! This well-maintained two-family home features two spacious units, each offering a kitchen, living room, dining room, 3 bedrooms, and 1 full bathroom. Ideally situated near schools, shopping, and dining, with easy access to NYC for commuters.First Floor has all new windows. Whether you're looking to live in one unit and rent the other or add to your investment portfolio, this property offers great potential. Schedule your private showing today!
Property Details
Home Type
- Multi-Family
Est. Annual Taxes
- $7,818
Home Design
- Aluminum Siding
Interior Spaces
- Living Room
- Dining Room
- Partially Finished Basement
Bedrooms and Bathrooms
- 6 Bedrooms | 3 Main Level Bedrooms
Additional Features
- Lot Dimensions are 25x95
- Heating System Uses Gas
Listing and Financial Details
- Legal Lot and Block 219 / 106
Map
Home Values in the Area
Average Home Value in this Area
Tax History
| Year | Tax Paid | Tax Assessment Tax Assessment Total Assessment is a certain percentage of the fair market value that is determined by local assessors to be the total taxable value of land and additions on the property. | Land | Improvement |
|---|---|---|---|---|
| 2025 | $7,818 | $447,500 | $201,500 | $246,000 |
| 2024 | $7,285 | $447,500 | $201,500 | $246,000 |
| 2023 | $7,285 | $447,500 | $201,500 | $246,000 |
| 2022 | $7,066 | $447,500 | $201,500 | $246,000 |
| 2021 | $8,060 | $137,700 | $24,600 | $113,100 |
| 2020 | $7,893 | $137,700 | $24,600 | $113,100 |
| 2019 | $7,885 | $137,700 | $24,600 | $113,100 |
| 2018 | $7,761 | $137,700 | $24,600 | $113,100 |
| 2017 | $7,616 | $137,700 | $24,600 | $113,100 |
| 2016 | $7,528 | $137,700 | $24,600 | $113,100 |
| 2015 | $7,725 | $146,000 | $24,600 | $121,400 |
| 2014 | $7,650 | $146,000 | $24,600 | $121,400 |
Property History
| Date | Event | Price | List to Sale | Price per Sq Ft |
|---|---|---|---|---|
| 10/21/2025 10/21/25 | Price Changed | $650,000 | -2.8% | -- |
| 10/01/2025 10/01/25 | Price Changed | $669,000 | -4.3% | -- |
| 09/30/2025 09/30/25 | For Sale | $699,000 | -- | -- |
Purchase History
| Date | Type | Sale Price | Title Company |
|---|---|---|---|
| Quit Claim Deed | -- | Mega Title Llc | |
| Bargain Sale Deed | $225,000 | Agent For Wfg Natl Title Ins | |
| Deed | -- | -- | |
| Deed | $125,000 | -- | |
| Sheriffs Deed | -- | None Available | |
| Bargain Sale Deed | $250,000 | Chicago Title Insurance Co | |
| Deed | $130,000 | -- |
Mortgage History
| Date | Status | Loan Amount | Loan Type |
|---|---|---|---|
| Previous Owner | $225,000 | Purchase Money Mortgage | |
| Previous Owner | $127,991 | FHA |
Source: Hudson County MLS
MLS Number: 250020181
APN: 08-00106-01-00219
Disclaimer: Certain information contained herein is derived from information provided by parties other than Homes.com. All information provided is deemed reliable, but is not guaranteed to be accurate and should be independently verified.
![]() IDX information is provided exclusively for personal, non-commercial use, and may not be used for any purpose other than to identify prospective properties consumers may be interested in purchasing.
IDX information is provided exclusively for personal, non-commercial use, and may not be used for any purpose other than to identify prospective properties consumers may be interested in purchasing.
Information is deemed reliable but not guaranteed.
- 1809 43rd St
- 1511 40th St
- 4410 Bergen Turnpike
- 1515 44th St
- 1437 Gehr Place
- 3602 Liberty Ave
- 3600 Charles Ct Unit 22
- 1433 43rd St
- 2009 46th St
- 1466 44th St
- 1505 46th St
- 3651 Meadow Ln Unit 5B
- 1711 47th St
- 1504 46th St
- 3721 Bergen Turnpike
- 1425 45th St
- 3617 Lincoln Terrace
- 1709 48th St
- 1432 46th St
- 4616 Meadowview Ave
- 1723 41st St Unit 2
- 3900 Liberty Ave Unit 1B
- 1502 39th St
- 1622 Union Turnpike Unit ID1301599P
- 4201 Bergen Turnpike Unit 2D
- 4201 Bergen Turnpike Unit 3A
- 4207 Grand Ave Unit 2
- 1626 Union Turnpike Unit ID1301595P
- 1626 Union Turnpike Unit ID1301596P
- 4414 Liberty Ave Unit 2
- 4414 Liberty Ave
- 4414 Liberty Ave Unit 1
- 3601 Liberty Ave Unit 501
- 3601 Liberty Ave Unit 309
- 4308 Grand Ave Unit 2
- 3508 Givernaud Terrace
- 1511 46th St Unit 2
- 3309 Liberty Ave
- 3309 Liberty Ave Unit 309
- 3309 Liberty Ave Unit 510
