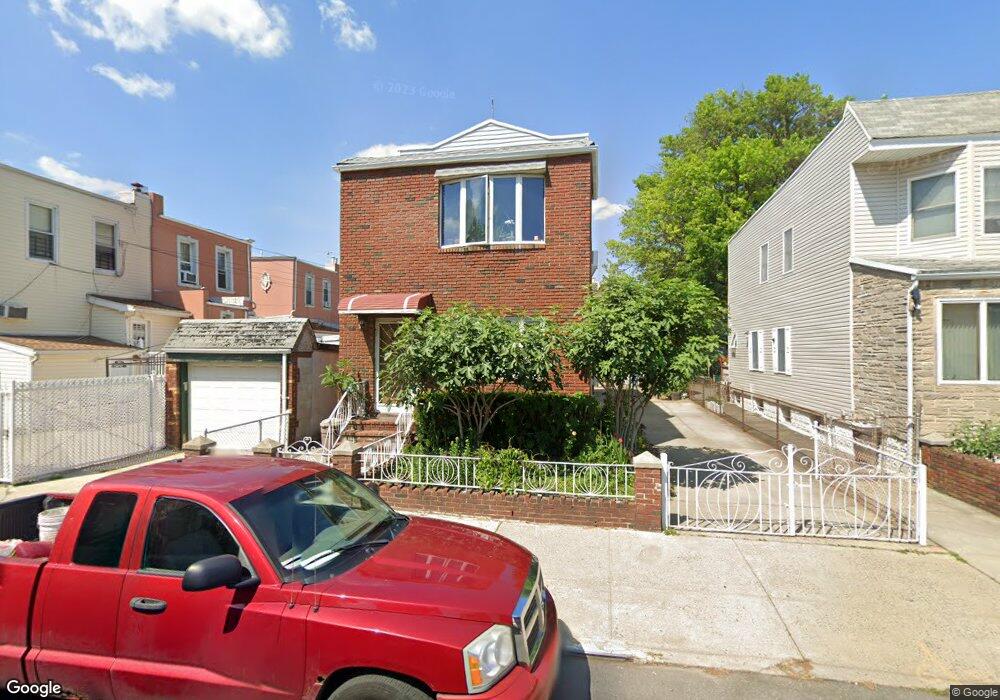
2013 77th St Brooklyn, NY 11214
Bensonhurst NeighborhoodEstimated Value: $1,291,069 - $1,901,000
Studio
--
Bath
1,962
Sq Ft
$820/Sq Ft
Est. Value
About This Home
This home is located at 2013 77th St, Brooklyn, NY 11214 and is currently estimated at $1,609,767, approximately $820 per square foot. 2013 77th St is a home located in Kings County with nearby schools including P.S. 186 Dr. Irving A. Gladstone Elementary School, Seth Low Intermediate School 96, and James Madison High School.
Ownership History
Date
Name
Owned For
Owner Type
Purchase Details
Closed on
Sep 8, 2009
Sold by
Chan Sau Chun Louisa
Bought by
Chan Julia Yi and Chan Scott Yu
Current Estimated Value
Purchase Details
Closed on
Oct 29, 1999
Sold by
Roca Sebastian
Bought by
Yu Lun Kin and Yu Chan Sau Chun
Create a Home Valuation Report for This Property
The Home Valuation Report is an in-depth analysis detailing your home's value as well as a comparison with similar homes in the area
Home Values in the Area
Average Home Value in this Area
Purchase History
| Date | Buyer | Sale Price | Title Company |
|---|---|---|---|
| Chan Julia Yi | $820,000 | -- | |
| Yu Lun Kin | $360,000 | Commonwealth Land Title Ins |
Source: Public Records
Tax History
| Year | Tax Paid | Tax Assessment Tax Assessment Total Assessment is a certain percentage of the fair market value that is determined by local assessors to be the total taxable value of land and additions on the property. | Land | Improvement |
|---|---|---|---|---|
| 2025 | $9,084 | $75,480 | $19,620 | $55,860 |
| 2024 | $9,084 | $73,020 | $19,620 | $53,400 |
| 2023 | $8,555 | $85,260 | $19,620 | $65,640 |
| 2022 | $8,011 | $79,380 | $19,620 | $59,760 |
| 2021 | $8,744 | $78,180 | $19,620 | $58,560 |
| 2020 | $8,422 | $69,180 | $19,620 | $49,560 |
| 2019 | $7,836 | $76,500 | $19,620 | $56,880 |
| 2018 | $7,176 | $36,660 | $9,020 | $27,640 |
| 2017 | $7,150 | $36,547 | $8,345 | $28,202 |
| 2016 | $6,886 | $35,996 | $11,094 | $24,902 |
| 2015 | $3,939 | $34,323 | $12,965 | $21,358 |
| 2014 | $3,939 | $32,382 | $11,604 | $20,778 |
Source: Public Records
Map
Nearby Homes
- 2039 78th St
- 1927 78th St Unit 4A
- 2101 76th St
- 2125 77th St
- 1912 Bay Ridge Pkwy
- 2040 73rd St
- 2024 80th St
- 1939 80th St
- 1973 81st St Unit C10
- 7201 20th Ave
- 2172 76th St
- 7322 19th Ave
- 2029 82nd St
- 7608 Bay Pkwy Unit 5C
- 7608 Bay Pkwy Unit 8C
- 1859 80th St
- 7516 Bay Pkwy Unit 4E
- 7308 19th Ave
- 1827 78th St Unit 1B
- 1839 79th St Unit 1B
Your Personal Tour Guide
Ask me questions while you tour the home.