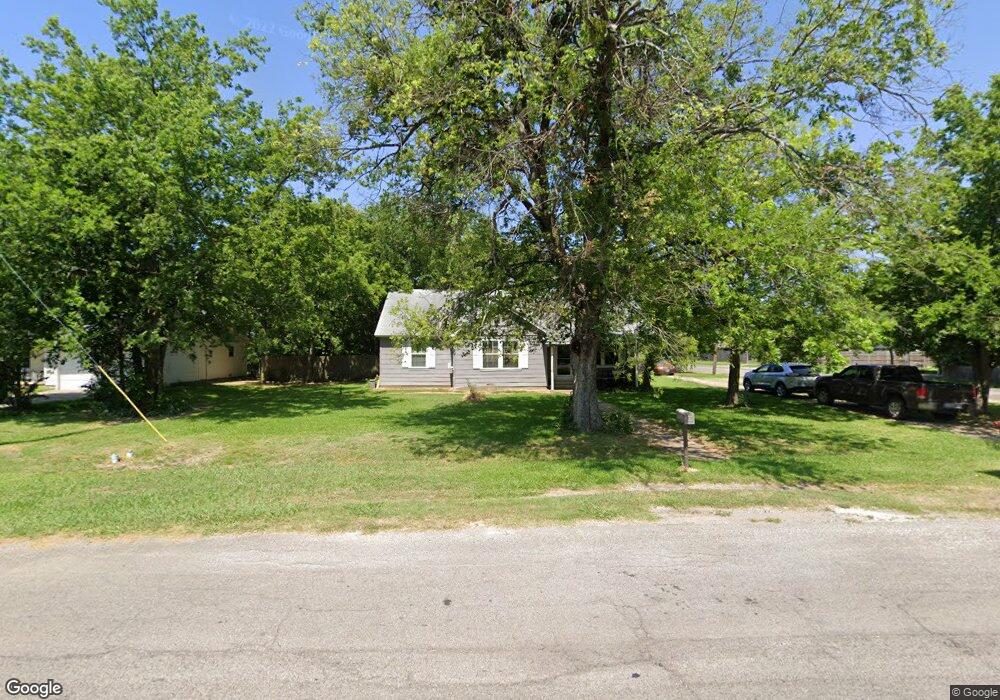
2013 Agnew St Bonham, TX 75418
Estimated Value: $214,000 - $268,000
4
Beds
2
Baths
2,273
Sq Ft
$105/Sq Ft
Est. Value
About This Home
This home is located at 2013 Agnew St, Bonham, TX 75418 and is currently estimated at $239,154, approximately $105 per square foot. 2013 Agnew St is a home located in Fannin County with nearby schools including Finley-Oates Elementary School and LH Rather Jr High School.
Ownership History
Date
Name
Owned For
Owner Type
Purchase Details
Closed on
May 17, 2019
Sold by
Douglas William and Douglas Deette
Bought by
Douglas William Leon
Current Estimated Value
Purchase Details
Closed on
Mar 1, 2013
Sold by
Ward Sandra and Lessley Sandra Ward
Bought by
Pontus Investment Portfolio Ii Llc
Create a Home Valuation Report for This Property
The Home Valuation Report is an in-depth analysis detailing your home's value as well as a comparison with similar homes in the area
Home Values in the Area
Average Home Value in this Area
Purchase History
| Date | Buyer | Sale Price | Title Company |
|---|---|---|---|
| Douglas William Leon | -- | None Available | |
| Pontus Investment Portfolio Ii Llc | -- | Accommodation | |
| Pontus Investment Portfolio Ii Llc | -- | Accommodation |
Source: Public Records
Tax History Compared to Growth
Tax History
| Year | Tax Paid | Tax Assessment Tax Assessment Total Assessment is a certain percentage of the fair market value that is determined by local assessors to be the total taxable value of land and additions on the property. | Land | Improvement |
|---|---|---|---|---|
| 2025 | $958 | $160,210 | $56,160 | $104,050 |
| 2024 | $958 | $102,620 | $60,570 | $42,050 |
| 2023 | $1,817 | $94,950 | $52,980 | $41,970 |
| 2022 | $1,843 | $83,790 | $40,970 | $42,820 |
| 2021 | $2,038 | $80,630 | $19,780 | $60,850 |
| 2020 | $1,926 | $75,340 | $19,250 | $56,090 |
| 2019 | $1,704 | $64,110 | $9,360 | $54,750 |
| 2018 | $1,198 | $45,150 | $9,360 | $35,790 |
| 2017 | $1,077 | $42,140 | $9,180 | $32,960 |
| 2016 | $1,017 | $39,810 | $9,180 | $30,630 |
| 2015 | -- | $41,120 | $8,830 | $32,290 |
| 2014 | -- | $33,742 | $8,300 | $25,442 |
Source: Public Records
Map
Nearby Homes
- 606 Hunter St
- 2108 Agnew St
- 1905 Agnew St
- 108 Leslie St
- 408 Rainey St
- 2099 Albert Broadfoot St
- 2099 Albert Broadfoot St Unit A
- TBD Saint Andrews Ct
- 2 Broadmoor Ct
- 1913 N Main St
- 2023 N Center St
- 4 Broadmoor Ct
- 0000 Texas 78
- 5354 S State Highway 78
- 106 Westwood Ct
- 2220 N Village Dr
- 0000 Lee St
- 1711 Oriental St
- 000 S State Highway 78
- 200 Victory St