NOT LISTED FOR SALE

Estimated Value: $205,000 - $223,545

3 Beds
2 Baths
1,924 Sq Ft
$113/Sq Ft Est. Value

Last Sold November 03, 2017

Last sale price $147,000 $76 Per Sq Ft

Est. 48% increase in value since last sale

Current estimated payment $1,550/month

About This Home

As of November 2017

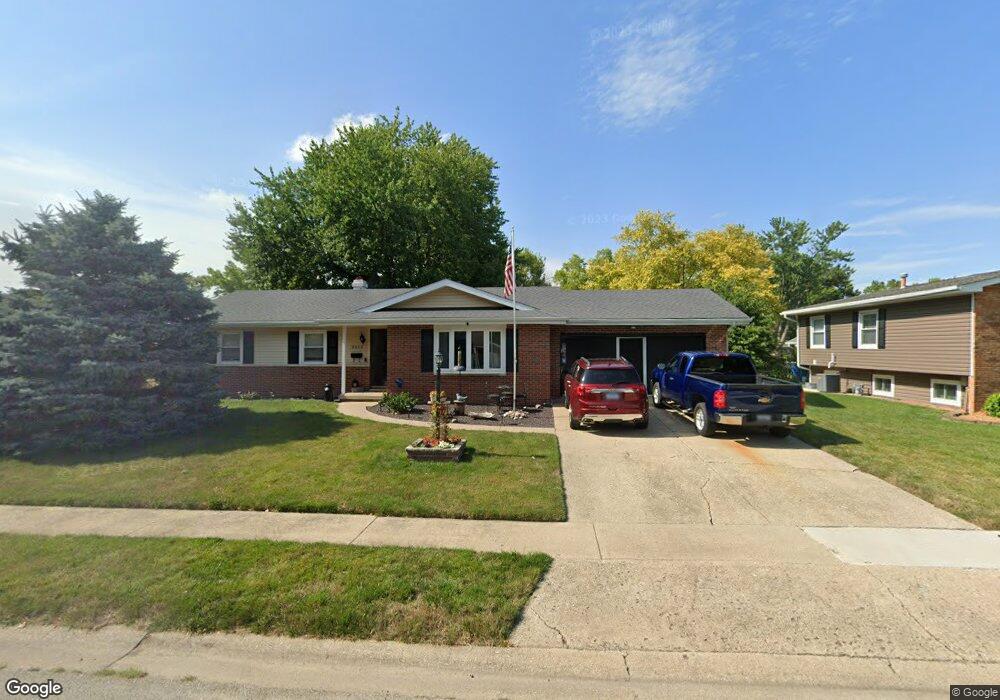
This home is located at 2013 Claremont Dr, Springfield, IL 62703 and is currently estimated at $217,886, approximately $113 per square foot. 2013 Claremont Dr is a home located in Sangamon County with nearby schools including Hazel Dell Elementary School, Jefferson Middle School, and Springfield Southeast High School.

Ownership History

Date Name Owned For Owner Type

Purchase Details

Closed on
Mar 18, 2008
Current Estimated Value
$217,886

Purchase Details

Closed on
Nov 15, 2006

Purchase Details

Closed on
Nov 26, 1999
Source: Public Records

Range of Values:

Collateral Analytics

Collateral Analytics Collateral Analytics AVMs (Automated Valuation Model) employ a number of statistical approaches combined with neighborhood-specific comparable selection guarantees the most up-to-date and precise valuations.

Not Available

Collateral Analytics does not have data for the current month. Please view the chart for historical values.

ICE

ICE Mortgage Technology ICE Mortgage Technology’s AVM (Automated Valuation Model) is a state-of-the-art online residential property valuation tool that provides a quick and accurate estimate of the value of almost any home in the U.S.

Not Available

ICE Mortgage Technology does not have data for the current month. Please view the chart for historical values.

First American

First American First American Data & Analytics’ next-generation AVM combines unrivaled data assets with a blended ensemble of valuation models to produce highly accurate, reliable valuations you can trust.

Not Available

First American does not have data for the current month. Please view the chart for historical values.

Quantarium

Quantarium Quantarium’s valuation service, repeatedly proven the industry’s most accurate and comprehensive, is supercharged with a self-learning and auto-tuning AI engine that continually becomes smarter and more accurate as it processes daily inputs from the industry’s leading RE data lake.

Not Available

Quantarium does not have data for the current month. Please view the chart for historical values.

Average Value
Not Available
List Price
Sold Price
Create a Home Valuation Report for This Property
The Home Valuation Report is an in-depth analysis detailing your home's value as well as a comparison with similar homes in the area

Home Values in the Area

Source: Public Records

Average Home Value in this Area


Source: Public Records

Purchase History

Date Buyer Sale Price Title Company
-- $143,500 --
-- $133,000 --
-- $103,000 --
Source: Public Records

Property History

Date Event Price List to Sale Price per Sq Ft Prior Sale
11/03/2017 11/03/17 Sold $147,000 -1.7% $76 / Sq Ft View Prior Sale
09/16/2017 09/16/17 Pending -- -- --
07/17/2017 07/17/17 For Sale $149,500 -- $78 / Sq Ft

Tax History Compared to Growth

Source: Public Records

Tax History

Year Tax Paid Tax Assessment Tax Assessment Total Assessment is a certain percentage of the fair market value that is determined by local assessors to be the total taxable value of land and additions on the property. Land Improvement
2024 $4,690 $61,840 $10,266 $51,574
2023 $4,463 $56,485 $9,377 $47,108
2022 $4,228 $53,187 $8,895 $44,292
2021 $4,068 $51,196 $8,562 $42,634
2020 $3,988 $51,273 $8,575 $42,698
2019 $3,912 $51,094 $8,545 $42,549
2018 $3,764 $50,549 $8,504 $42,045
2017 $3,704 $50,189 $8,394 $41,795
2016 $3,624 $49,457 $8,272 $41,185
2015 $3,583 $48,866 $8,173 $40,693
2014 $3,547 $48,550 $8,120 $40,430
2013 $3,468 $48,799 $8,120 $40,679
Source: Public Records

Agents Affiliated with this Home

  • Section Image
See All Agents

Map