
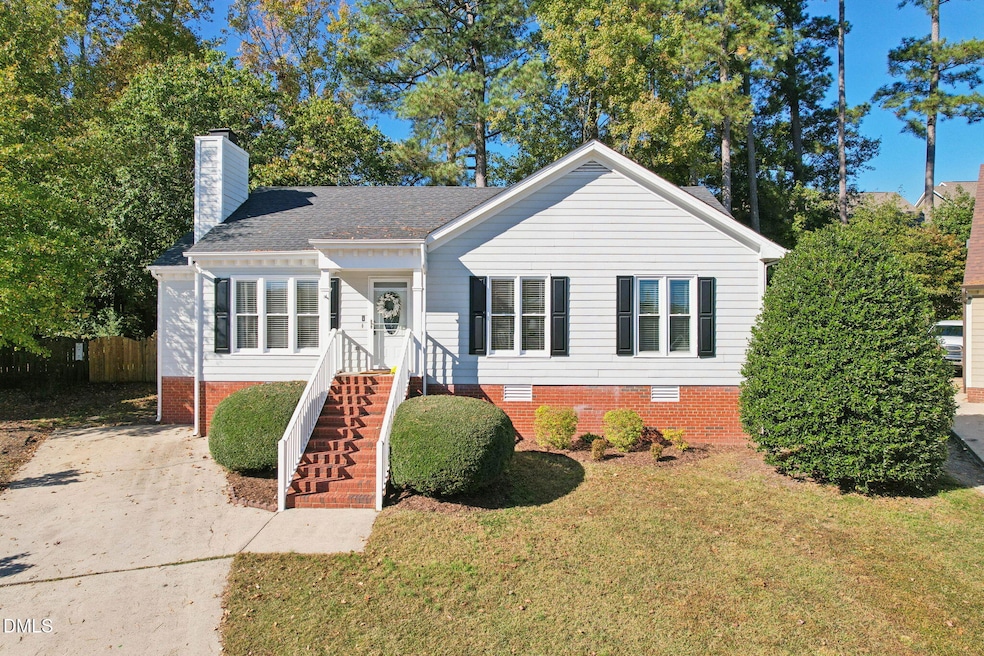

2013 Keokuk Ct Apex, NC 27523
West Cary NeighborhoodEstimated payment $2,885/month
Total Views
19,828
3
Beds
2
Baths
1,381
Sq Ft
$349
Price per Sq Ft
Highlights
- Popular Property
- Deck
- Transitional Architecture
- Salem Elementary Rated A
- Vaulted Ceiling
- Wood Flooring
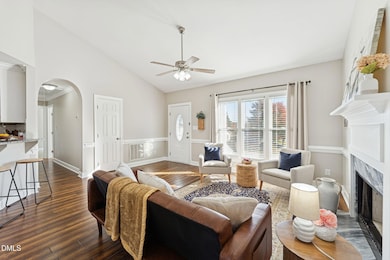
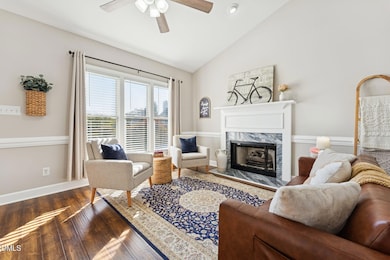
About This Home
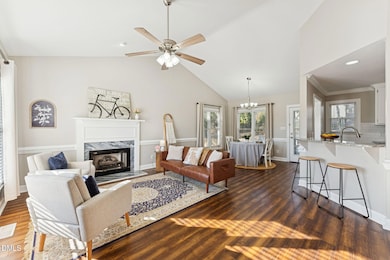
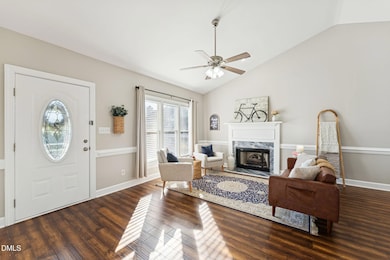
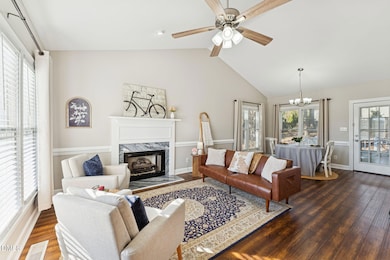
Nestled in one of Apex's most desirable neighborhoods, this charming and beautifully maintained 3-bedroom, 2-bath ranch offers comfort, style, and convenience. Located at the end of a peaceful cul-de-sac, the home features an open layout with vaulted ceilings in the living and dining areas, creating a bright, spacious feel filled with natural light. The spacious kitchen is designed for modern living with granite countertops and stainless appliances. Thoughtful updates over the past few years include: Roof (2019) HVAC system (2019) Fresh interior paint on walls, trim, and doors (October 2025) New dishwasher (2025) Enjoy outdoor living in the large fenced backyard, perfect for children, pets, and entertaining. A wired workshop/shed with electricity and a refrigerator (included) provides great extra space for hobbies or storage. Community amenities include a pool and playground, adding to the appeal of this well-loved home. 💰 Bonus: Receive a $2,000 lender credit when using the seller's preferred lender!
Home Details
Home Type
- Single Family
Est. Annual Taxes
- $3,508
Year Built
- Built in 1996
Lot Details
- 0.25 Acre Lot
- Cul-De-Sac
- Landscaped with Trees
- Back Yard Fenced
HOA Fees
- $52 Monthly HOA Fees
Parking
- Private Driveway
Home Design
- Transitional Architecture
- Architectural Shingle Roof
- Masonite
Interior Spaces
- 1,381 Sq Ft Home
- 1-Story Property
- Smooth Ceilings
- Vaulted Ceiling
- Ceiling Fan
- 1 Fireplace
- Combination Dining and Living Room
- Storage
- Wood Flooring
- Crawl Space
- Storm Doors
Kitchen
- Range
- Microwave
- Dishwasher
Bedrooms and Bathrooms
- 3 Bedrooms
- Walk-In Closet
- 2 Full Bathrooms
- Primary bathroom on main floor
- Separate Shower in Primary Bathroom
- Separate Shower
Laundry
- Laundry in Hall
- Laundry on main level
Outdoor Features
- Deck
- Front Porch
Schools
- Salem Elementary And Middle School
- Green Hope High School
Utilities
- Central Air
- Heating System Uses Gas
- Gas Water Heater
Listing and Financial Details
- Assessor Parcel Number 0733.04-71-8556-000
Community Details
Overview
- Association fees include unknown
- Rs Fincher Association, Phone Number (919) 362-1460
- Charleston Village Subdivision
Recreation
- Community Playground
- Community Pool
Map
Create a Home Valuation Report for This Property
The Home Valuation Report is an in-depth analysis detailing your home's value as well as a comparison with similar homes in the area
Home Values in the Area
Average Home Value in this Area
Tax History
| Year | Tax Paid | Tax Assessment Tax Assessment Total Assessment is a certain percentage of the fair market value that is determined by local assessors to be the total taxable value of land and additions on the property. | Land | Improvement |
|---|---|---|---|---|
| 2025 | $3,508 | $399,534 | $200,000 | $199,534 |
| 2024 | $3,430 | $399,534 | $200,000 | $199,534 |
| 2023 | $3,116 | $282,206 | $120,000 | $162,206 |
| 2022 | $2,925 | $282,206 | $120,000 | $162,206 |
| 2021 | $2,814 | $282,206 | $120,000 | $162,206 |
| 2020 | $2,786 | $282,206 | $120,000 | $162,206 |
| 2019 | $2,248 | $196,144 | $84,000 | $112,144 |
| 2018 | $2,118 | $196,144 | $84,000 | $112,144 |
| 2017 | $1,972 | $196,144 | $84,000 | $112,144 |
| 2016 | $1,943 | $196,144 | $84,000 | $112,144 |
| 2015 | $1,890 | $186,142 | $74,000 | $112,142 |
| 2014 | $1,822 | $186,142 | $74,000 | $112,142 |
Source: Public Records
Property History
| Date | Event | Price | List to Sale | Price per Sq Ft |
|---|---|---|---|---|
| 10/24/2025 10/24/25 | For Sale | $482,500 | -- | $349 / Sq Ft |
Source: Doorify MLS
Purchase History
| Date | Type | Sale Price | Title Company |
|---|---|---|---|
| Warranty Deed | $302,000 | None Available | |
| Warranty Deed | $195,000 | None Available | |
| Warranty Deed | $140,000 | -- |
Source: Public Records
Mortgage History
| Date | Status | Loan Amount | Loan Type |
|---|---|---|---|
| Open | $238,400 | New Conventional | |
| Previous Owner | $215,500 | Construction | |
| Previous Owner | $132,900 | No Value Available |
Source: Public Records
About the Listing Agent
Because it's more than a home and you deserve more than an agent! So, my commitment to you provides almost 2 decades of personal and dedicated service which I have grown locally. Based in Sanford, NC, my expertise extends throughout Harnett, Lee, Cumberland, Moore, Wake, and Chatham counties. Many of my clients are first time buyers as well as many active-duty service members, military Veterans, and past clients looking to sell and purchase again. I have extensive experience with military
Angela's Other Listings
Source: Doorify MLS
MLS Number: 10129689
APN: 0733.04-71-8556-000
Disclaimer: Certain information contained herein is derived from information provided by parties other than Homes.com. All information provided is deemed reliable, but is not guaranteed to be accurate and should be independently verified.
![]() Some IDX listings have been excluded from this IDX display. Brokers make an effort to deliver accurate information, but buyers should independently verify any information on which they will rely in a transaction. The listing broker shall not be responsible for any typographical errors, misinformation, or misprints, and they shall be held totally harmless from any damages arising from reliance upon this data. This data is provided exclusively for consumers’ personal, non-commercial use. Listings marked with an icon are provided courtesy of the Doorify MLS, Inc. of North Carolina, Internet Data Exchange Database. Closed (sold) listings may have been listed and/or sold by a real estate firm other than the firm(s) featured on this website. Closed data is not available until the sale of the property is recorded in the MLS. Home sale data is not an appraisal, CMA, competitive or comparative market analysis, or home valuation of any property. Copyright 2025 Doorify MLS, Inc. of North Carolina. All rights reserved.
Some IDX listings have been excluded from this IDX display. Brokers make an effort to deliver accurate information, but buyers should independently verify any information on which they will rely in a transaction. The listing broker shall not be responsible for any typographical errors, misinformation, or misprints, and they shall be held totally harmless from any damages arising from reliance upon this data. This data is provided exclusively for consumers’ personal, non-commercial use. Listings marked with an icon are provided courtesy of the Doorify MLS, Inc. of North Carolina, Internet Data Exchange Database. Closed (sold) listings may have been listed and/or sold by a real estate firm other than the firm(s) featured on this website. Closed data is not available until the sale of the property is recorded in the MLS. Home sale data is not an appraisal, CMA, competitive or comparative market analysis, or home valuation of any property. Copyright 2025 Doorify MLS, Inc. of North Carolina. All rights reserved.
Nearby Homes
- 613 Pointe Grove Ln
- 700 Oak Ridge Dr
- 709 Oak Ridge Dr
- 721 Oak Ridge Dr
- 708 Oak Ridge Dr
- 705 Oak Ridge Dr
- 720 Oak Ridge Dr
- 712 Oak Ridge Dr
- 713 Oak Ridge Dr
- 2201 Dial Dr
- 6824 Wood Forest Dr
- 2021 Patapsco Dr
- 1808 Beaudet Ln
- 114 Calebra Way
- 320 Sutton Glen Dr
- 2300 Walden Creek Dr
- 479 Clark Creek Ln
- 471 Clark Creek Ln
- 2411 Colony Woods Dr
- 7736 Roberts Rd
- 1905 Castleburg Dr
- 1000 Cameron Woods Dr
- 2312 Colony Woods Dr
- 473 Autumn Rain St
- 1209 Corkery Ridge Ct
- 2125 Grouse Ski Cir
- 7226 Morris Acres Rd
- 316 Rapport Dr
- 201 Union Mills Way
- 1531 Haywards Heath Ln
- 134 Darley Dale Loop
- 1532 Haywards Heath Ln
- 100 Ranger Place
- 4001 Reedybrook Crossing
- 130 Brittingham Loop Unit Haddon Hall
- 317 Euphoria Cir
- 101 Stanza Ct
- 1142 Lookout Ridge Rd
- 689 Maple Grove Way
- 408 Parlier Dr