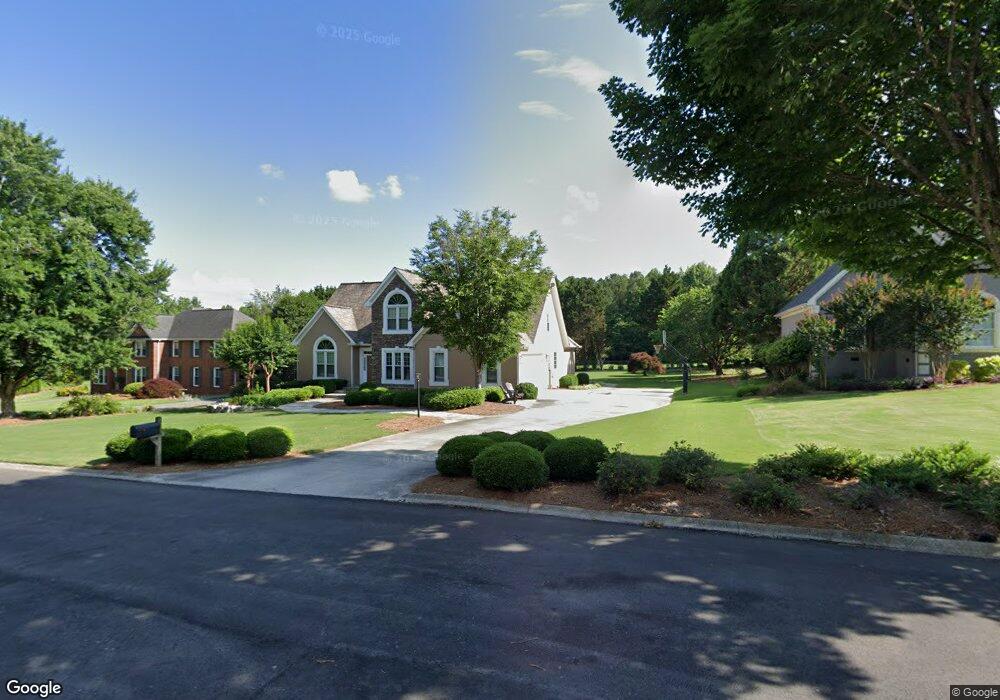
2013 Summerfield Chase Dalton, GA 30720
Estimated Value: $469,000 - $538,000
4
Beds
3
Baths
3,014
Sq Ft
$168/Sq Ft
Est. Value
About This Home
This home is located at 2013 Summerfield Chase, Dalton, GA 30720 and is currently estimated at $505,956, approximately $167 per square foot. 2013 Summerfield Chase is a home located in Whitfield County with nearby schools including Dug Gap Elementary School, Valley Point Middle School, and Southeast Whitfield County High School.
Ownership History
Date
Name
Owned For
Owner Type
Purchase Details
Closed on
Feb 10, 2025
Sold by
Sides Stephen R and Sides Elizabeth F
Bought by
Brown Courtney Keller
Current Estimated Value
Home Financials for this Owner
Home Financials are based on the most recent Mortgage that was taken out on this home.
Original Mortgage
$420,000
Outstanding Balance
$417,514
Interest Rate
6.93%
Mortgage Type
New Conventional
Estimated Equity
$88,442
Purchase Details
Closed on
Dec 8, 2004
Sold by
Prudential Residential Service
Bought by
Sides Stephen R and Sides Elizabeth F
Purchase Details
Closed on
Feb 15, 2001
Sold by
Kalish William B and Kalish Joann M
Bought by
Cusick James E and Cusick Kimberly A
Purchase Details
Closed on
Mar 1, 1996
Bought by
Kalish William B and Kalish Joann M
Create a Home Valuation Report for This Property
The Home Valuation Report is an in-depth analysis detailing your home's value as well as a comparison with similar homes in the area
Home Values in the Area
Average Home Value in this Area
Purchase History
| Date | Buyer | Sale Price | Title Company |
|---|---|---|---|
| Brown Courtney Keller | -- | None Listed On Document | |
| Brown Courtney Keller | $525,000 | None Listed On Document | |
| Brown Courtney Keller | $525,000 | None Listed On Document | |
| Sides Stephen R | $280,000 | -- | |
| Prudential Residential Services Limited | $280,000 | -- | |
| Cusick James E | $237,500 | -- | |
| Kalish William B | $225,000 | -- |
Source: Public Records
Mortgage History
| Date | Status | Borrower | Loan Amount |
|---|---|---|---|
| Open | Brown Courtney Keller | $420,000 | |
| Closed | Brown Courtney Keller | $420,000 |
Source: Public Records
Tax History Compared to Growth
Tax History
| Year | Tax Paid | Tax Assessment Tax Assessment Total Assessment is a certain percentage of the fair market value that is determined by local assessors to be the total taxable value of land and additions on the property. | Land | Improvement |
|---|---|---|---|---|
| 2024 | $3,291 | $188,458 | $19,200 | $169,258 |
| 2023 | $3,291 | $116,702 | $12,000 | $104,702 |
| 2022 | $2,705 | $100,273 | $12,000 | $88,273 |
| 2021 | $2,706 | $100,273 | $12,000 | $88,273 |
| 2020 | $2,786 | $100,273 | $12,000 | $88,273 |
| 2019 | $2,784 | $98,884 | $12,000 | $86,884 |
| 2018 | $2,823 | $98,884 | $12,000 | $86,884 |
| 2017 | $2,824 | $98,884 | $12,000 | $86,884 |
| 2016 | $2,510 | $91,666 | $12,600 | $79,066 |
| 2014 | $2,268 | $91,666 | $12,600 | $79,066 |
| 2013 | -- | $91,666 | $12,600 | $79,066 |
Source: Public Records
Map
Nearby Homes
- 103 Southwind Terrace
- 2512 Dug Gap Rd
- 1108 Sunset Dr SW
- 512 Dalewood Dr
- 315 Summit Cir SW
- 2606 Foxmore Cir
- 2654 Foxmore Cir
- 0 N Dug Gap Rd Unit 20254832
- 0 N Dug Gap Rd Unit RTC3015177
- 0 N Dug Gap Rd Unit 131142
- 506 Lavista Rd
- 0 Shannon Dr Unit 131263
- 150 Forest Hill Rd SW
- 1929 Sourwood Dr
- 107 Hill Cir
- 604 Foster Rd
- 000 S Dixie Hwy
- 120 Foothill Dr
- 1911 Sourwood Dr
- 608 Brookview Ln
- 2012 Summerfield Chase
- 2015 Summerfield Chase
- 2011 Summerfield Chase
- 2009 Summerfield Chase
- 2014 Summerfield Chase
- 2010 Summerfield Chase
- 2011 Greenfield Place
- 2017 Summerfield Chase
- 2009 Greenfield Place
- 2019 Summerfield Chase
- 100 Chickering Way
- 2010 Greenfield Place
- 102 Chickering Way
- 2008 Greenfield Place
- 105 Southwind Terrace
- 2021 Summerfield Chase
- 0 Greenfield Place
- LOT 34 Greenfield Place
- 104 Chickering Way
- 101 Chickering Way