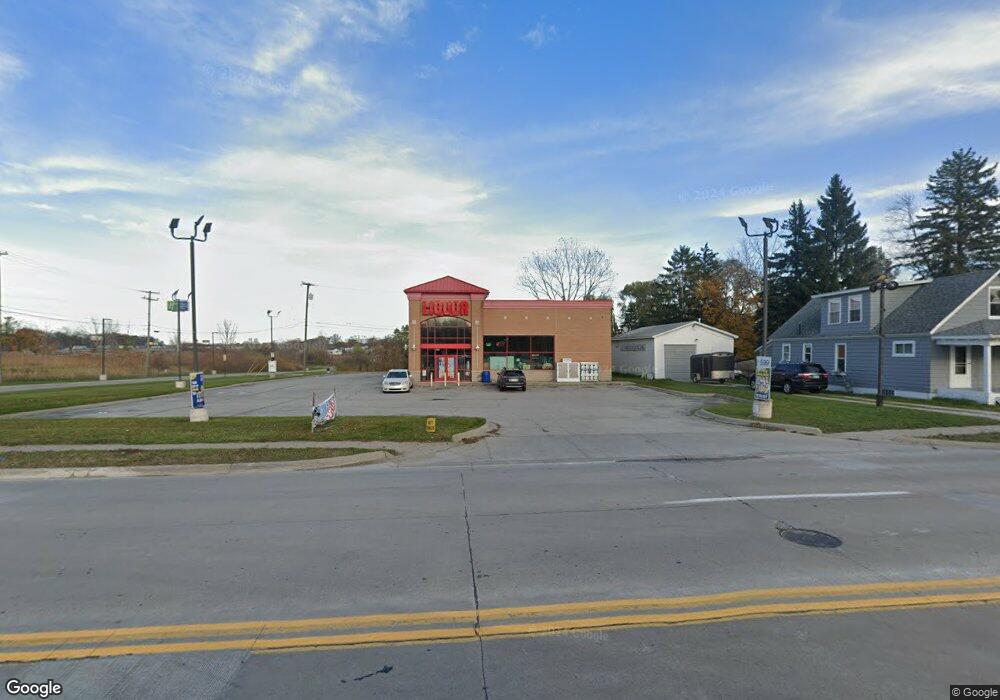
2013 Water St Port Huron, MI 48060
Estimated Value: $3,473,117
--
Bed
--
Bath
5,000
Sq Ft
$695/Sq Ft
Est. Value
About This Home
This home is located at 2013 Water St, Port Huron, MI 48060 and is currently estimated at $3,473,117, approximately $694 per square foot. 2013 Water St is a home located in St. Clair County with nearby schools including H.D. Crull Elementary School, Holland Woods Middle School, and Port Huron High School.
Ownership History
Date
Name
Owned For
Owner Type
Purchase Details
Closed on
Aug 31, 2009
Sold by
Lighthouse Properties Of Port Huron Llc
Bought by
Ala & Kevin Llc
Current Estimated Value
Home Financials for this Owner
Home Financials are based on the most recent Mortgage that was taken out on this home.
Original Mortgage
$1,120,000
Outstanding Balance
$733,220
Interest Rate
5.21%
Mortgage Type
Commercial
Estimated Equity
$2,739,897
Purchase Details
Closed on
Mar 29, 2007
Sold by
Salamey Nassir M
Bought by
Salamey Nassir M and Salamey Khadige
Create a Home Valuation Report for This Property
The Home Valuation Report is an in-depth analysis detailing your home's value as well as a comparison with similar homes in the area
Home Values in the Area
Average Home Value in this Area
Purchase History
| Date | Buyer | Sale Price | Title Company |
|---|---|---|---|
| Ala & Kevin Llc | $1,200,000 | None Available | |
| Salamey Nassir M | -- | None Available |
Source: Public Records
Mortgage History
| Date | Status | Borrower | Loan Amount |
|---|---|---|---|
| Open | Ala & Kevin Llc | $1,120,000 |
Source: Public Records
Tax History Compared to Growth
Tax History
| Year | Tax Paid | Tax Assessment Tax Assessment Total Assessment is a certain percentage of the fair market value that is determined by local assessors to be the total taxable value of land and additions on the property. | Land | Improvement |
|---|---|---|---|---|
| 2025 | $10,367 | $349,900 | $0 | $0 |
| 2024 | $6,535 | $315,300 | $0 | $0 |
| 2023 | $6,126 | $295,000 | $0 | $0 |
| 2022 | $8,560 | $292,600 | $0 | $0 |
| 2021 | $7,952 | $286,000 | $0 | $0 |
| 2020 | $7,952 | $316,800 | $74,500 | $242,300 |
| 2019 | $7,803 | $160,900 | $0 | $0 |
| 2018 | $7,621 | $160,900 | $0 | $0 |
| 2017 | $7,455 | $155,300 | $0 | $0 |
| 2016 | $5,105 | $155,300 | $0 | $0 |
| 2015 | -- | $149,200 | $75,800 | $73,400 |
| 2014 | -- | $140,700 | $51,300 | $89,400 |
| 2013 | -- | $181,800 | $0 | $0 |
Source: Public Records
Map
Nearby Homes
- 0000 Campau Ave
- V/L #4 Water St
- V/L #6 Water St
- V/L #5 Water St
- V/L #8 Water St
- V/L #3 Water St
- 0000 Water St
- 1825 Kern St
- 1819 Kern St
- 00 Campau Ave
- 146 Taylor St
- 1819 Riverside Dr
- 1907 Riverside Dr
- 1649 Whipple St
- 0000 Manuel St
- 1620 McBrady St
- 1534 12th Ave
- 0000 Henry St
- 1434 Nelson St
- 2838 Elmwood St