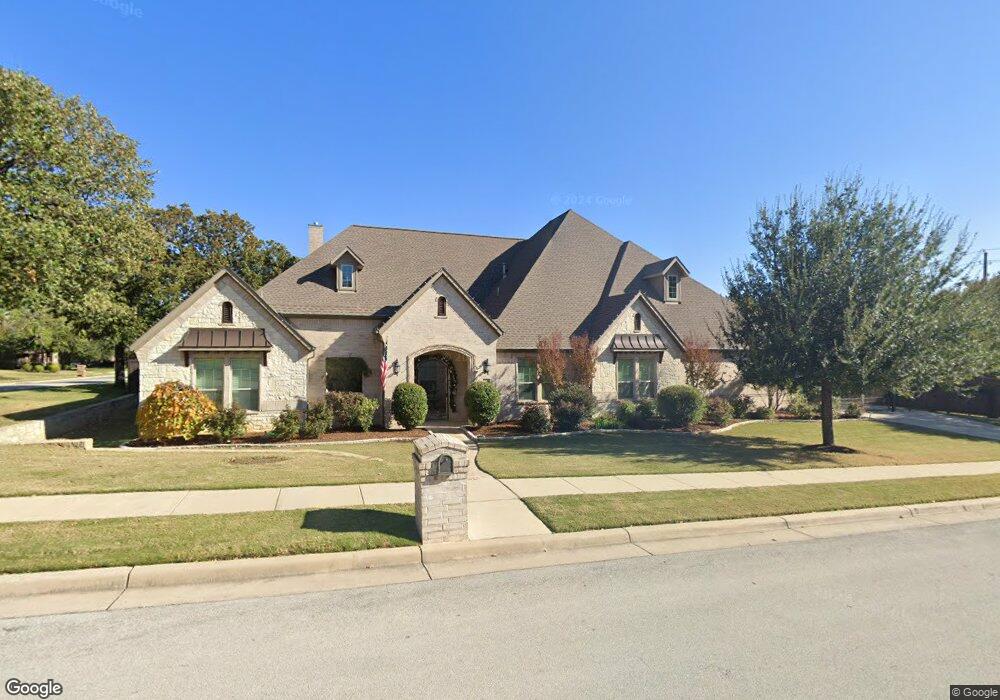
2013 Woodbury Ct Southlake, TX 76092
Estimated Value: $1,166,251 - $1,564,000
3
Beds
3
Baths
3,594
Sq Ft
$374/Sq Ft
Est. Value
About This Home
This home is located at 2013 Woodbury Ct, Southlake, TX 76092 and is currently estimated at $1,345,063, approximately $374 per square foot. 2013 Woodbury Ct is a home with nearby schools including Carroll Elementary School, Eubanks Intermediate School, and George Dawson Middle School.
Ownership History
Date
Name
Owned For
Owner Type
Purchase Details
Closed on
Aug 15, 2023
Sold by
Northrip Richard N and Northrip Carol A
Bought by
Northrip Family Trust and Northrip
Current Estimated Value
Purchase Details
Closed on
Nov 22, 2013
Sold by
Mortgage Development Company Llc
Bought by
Northrip Ricahard and Northrip Carol
Home Financials for this Owner
Home Financials are based on the most recent Mortgage that was taken out on this home.
Original Mortgage
$330,000
Interest Rate
4.34%
Mortgage Type
Unknown
Purchase Details
Closed on
Mar 12, 2013
Sold by
First National Bank
Bought by
Montage Development Co
Home Financials for this Owner
Home Financials are based on the most recent Mortgage that was taken out on this home.
Original Mortgage
$510,000
Interest Rate
3.59%
Mortgage Type
Purchase Money Mortgage
Create a Home Valuation Report for This Property
The Home Valuation Report is an in-depth analysis detailing your home's value as well as a comparison with similar homes in the area
Home Values in the Area
Average Home Value in this Area
Purchase History
| Date | Buyer | Sale Price | Title Company |
|---|---|---|---|
| Northrip Family Trust | -- | None Listed On Document | |
| Northrip Ricahard | $658,747 | None Available | |
| Montage Development Co | -- | None Available |
Source: Public Records
Mortgage History
| Date | Status | Borrower | Loan Amount |
|---|---|---|---|
| Previous Owner | Northrip Ricahard | $330,000 | |
| Previous Owner | Montage Development Co | $510,000 |
Source: Public Records
Tax History Compared to Growth
Tax History
| Year | Tax Paid | Tax Assessment Tax Assessment Total Assessment is a certain percentage of the fair market value that is determined by local assessors to be the total taxable value of land and additions on the property. | Land | Improvement |
|---|---|---|---|---|
| 2025 | $19,659 | $1,124,029 | $379,710 | $744,319 |
| 2024 | $19,659 | $1,124,029 | $379,710 | $744,319 |
| 2023 | $16,867 | $1,127,435 | $379,710 | $747,725 |
| 2022 | $18,149 | $927,564 | $253,925 | $673,639 |
| 2021 | $17,437 | $764,777 | $253,925 | $510,852 |
| 2020 | $17,755 | $772,421 | $232,065 | $540,356 |
| 2019 | $18,569 | $766,820 | $125,000 | $641,820 |
| 2018 | $13,128 | $749,518 | $125,000 | $624,518 |
| 2017 | $18,649 | $752,406 | $125,000 | $627,406 |
| 2016 | $17,935 | $742,804 | $125,000 | $617,804 |
| 2015 | $13,083 | $657,800 | $125,000 | $532,800 |
| 2014 | $13,083 | $657,800 | $125,000 | $532,800 |
Source: Public Records
Map
Nearby Homes
- 1904 Cresson Dr
- 1010 Deer Hollow Blvd
- 945 Deer Hollow Blvd
- 1005 Siena Dr
- 929 Winding Ridge Trail
- 1205 Scenic Dr
- 3325 Creek Rd
- 2401 Lower Brook Ct
- 710 Deer Hollow Blvd
- 606 Eagle Ct
- 602 Signet Ct
- 690 S Peytonville Ave
- 1002 Chimney Hill Trail
- 2616 Park Grove Loop
- 2525 Park Grove Loop
- 1206 Oakwood Trail
- 1212 Oakwood Trail
- 2620 Park Grove Loop
- 2728 Edgebrook Ct
- 503 Sorenson Trail
- 2024 Woodbury Ct
- 2012 Woodbury Ct
- 2020 Woodbury Ct
- 1111 Woodbury Ct
- 2005 Woodbury Ct
- 2008 Woodbury Ct
- 2008 Woodbury Ct
- 2016 Woodbury Ct
- 1904 Amesbury Ct
- 1906 Amesbury Ct
- 2000 Woodbury Ct
- 1902 Amesbury Ct
- 2004 Woodbury Ct
- 2004 Woodbury Ct
- 2100 W Continental Blvd
- 1100 Deer Hollow Blvd
- 1900 Amesbury Ct
- 1907 Amesbury Ct
- 1903 Amesbury Ct
- 1905 Amesbury Ct