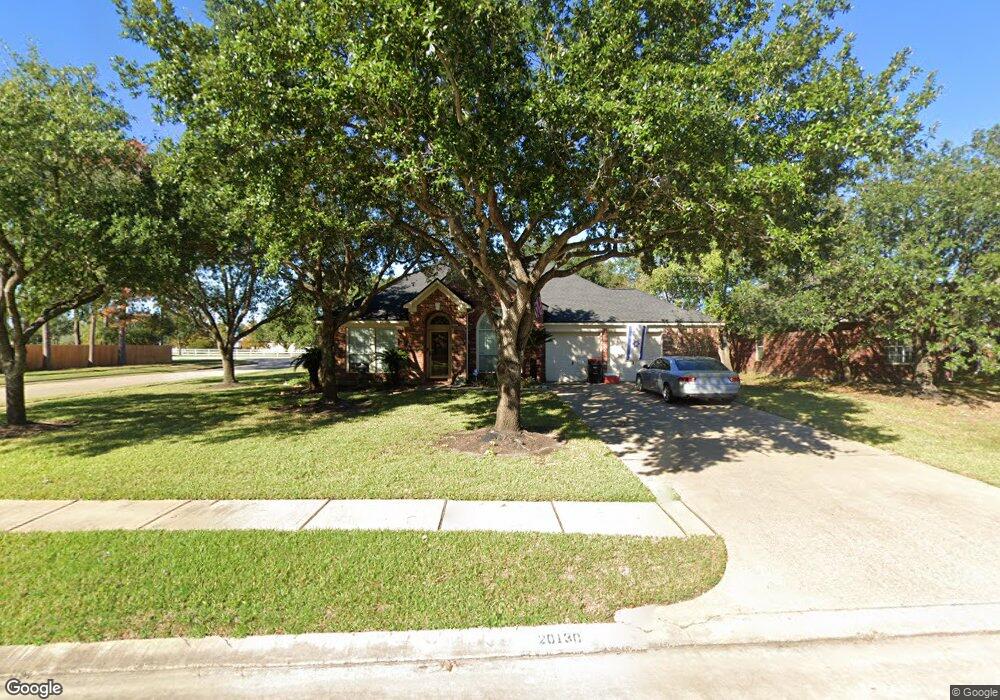
20130 Chad Arbor Trail Cypress, TX 77433
Fairfield Village NeighborhoodEstimated Value: $365,000 - $414,000
4
Beds
3
Baths
2,515
Sq Ft
$152/Sq Ft
Est. Value
About This Home
This home is located at 20130 Chad Arbor Trail, Cypress, TX 77433 and is currently estimated at $382,114, approximately $151 per square foot. 20130 Chad Arbor Trail is a home located in Harris County with nearby schools including Keith Elementary School, Salyards Middle, and Bridgeland High School.
Ownership History
Date
Name
Owned For
Owner Type
Purchase Details
Closed on
Jul 15, 2008
Sold by
Weathers Vivian V
Bought by
Vaughn Neven Kori Lynn and Vaughn Neven Eric
Current Estimated Value
Home Financials for this Owner
Home Financials are based on the most recent Mortgage that was taken out on this home.
Original Mortgage
$205,377
Outstanding Balance
$132,629
Interest Rate
6.09%
Mortgage Type
FHA
Estimated Equity
$249,485
Purchase Details
Closed on
Jun 28, 2007
Sold by
Weathers George P
Bought by
Weathers Vivian V
Purchase Details
Closed on
Jun 16, 2000
Sold by
Perry Homes
Bought by
Weathers George Paul and Weathers Vivian V
Home Financials for this Owner
Home Financials are based on the most recent Mortgage that was taken out on this home.
Original Mortgage
$148,100
Interest Rate
8.5%
Create a Home Valuation Report for This Property
The Home Valuation Report is an in-depth analysis detailing your home's value as well as a comparison with similar homes in the area
Home Values in the Area
Average Home Value in this Area
Purchase History
| Date | Buyer | Sale Price | Title Company |
|---|---|---|---|
| Vaughn Neven Kori Lynn | -- | Chicago Title | |
| Weathers Vivian V | -- | None Available | |
| Weathers George Paul | -- | Chicago Title |
Source: Public Records
Mortgage History
| Date | Status | Borrower | Loan Amount |
|---|---|---|---|
| Open | Vaughn Neven Kori Lynn | $205,377 | |
| Previous Owner | Weathers George Paul | $148,100 | |
| Closed | Weathers Vivian V | $0 |
Source: Public Records
Tax History Compared to Growth
Tax History
| Year | Tax Paid | Tax Assessment Tax Assessment Total Assessment is a certain percentage of the fair market value that is determined by local assessors to be the total taxable value of land and additions on the property. | Land | Improvement |
|---|---|---|---|---|
| 2025 | $5,315 | $343,965 | $81,837 | $262,128 |
| 2024 | $5,315 | $345,309 | $81,837 | $263,472 |
| 2023 | $5,315 | $394,500 | $81,837 | $312,663 |
| 2022 | $7,585 | $356,283 | $74,437 | $281,846 |
| 2021 | $7,279 | $278,251 | $74,437 | $203,814 |
| 2020 | $7,345 | $271,102 | $46,578 | $224,524 |
| 2019 | $7,155 | $254,558 | $39,613 | $214,945 |
| 2018 | $2,502 | $248,437 | $39,613 | $208,824 |
| 2017 | $7,071 | $248,437 | $39,613 | $208,824 |
| 2016 | $7,071 | $248,437 | $39,613 | $208,824 |
| 2015 | $5,158 | $243,057 | $39,613 | $203,444 |
| 2014 | $5,158 | $208,451 | $39,613 | $168,838 |
Source: Public Records
Map
Nearby Homes
- 18234 Shoreline Vista Ln
- 20207 Fairfield Trace Dr
- 16503 Preston Falls Dr
- 20527 S Blue Hyacinth Dr
- 15003 Big Spring Park Dr
- 20610 S Blue Hyacinth Dr
- 15918 Lake Loop Dr
- 20319 Hillside Grove Ln
- 20622 Tulip Blossom Ct
- 20714 N Blue Hyacinth Dr
- 15903 Pebble Creek Trail
- 16407 Thyme Green Ln
- 16603 Radiant Lilac Trail
- 20815 Golden Sycamore Trail
- 16703 Radiant Lilac Trail
- 15827 Heartwood Way
- 16714 Radiant Lilac Trail
- 16722 Orchid Mist Dr
- 20803 Twisted Leaf Dr
- 20807 Twisted Leaf Dr
- 20126 Chad Arbor Trail
- 20122 Chad Arbor Trail
- 20206 Chad Arbor Trail
- 20118 Chad Arbor Trail
- 20131 Chad Arbor Trail
- 20127 Chad Arbor Trail
- 20210 Chad Arbor Trail
- 20203 Chad Arbor Trail
- 20123 Chad Arbor Trail
- 20207 Chad Arbor Trail
- 20114 Chad Arbor Trail
- 20119 Chad Arbor Trail
- 20214 Chad Arbor Trail
- 20211 Chad Arbor Trail
- 20115 Chad Arbor Trail
- 16402 Saddle Ridge Pass
- 20202 Emily Anne Ct
- 20206 Emily Anne Ct
- 20110 Chad Arbor Trail
- 20122 Emily Anne Ct