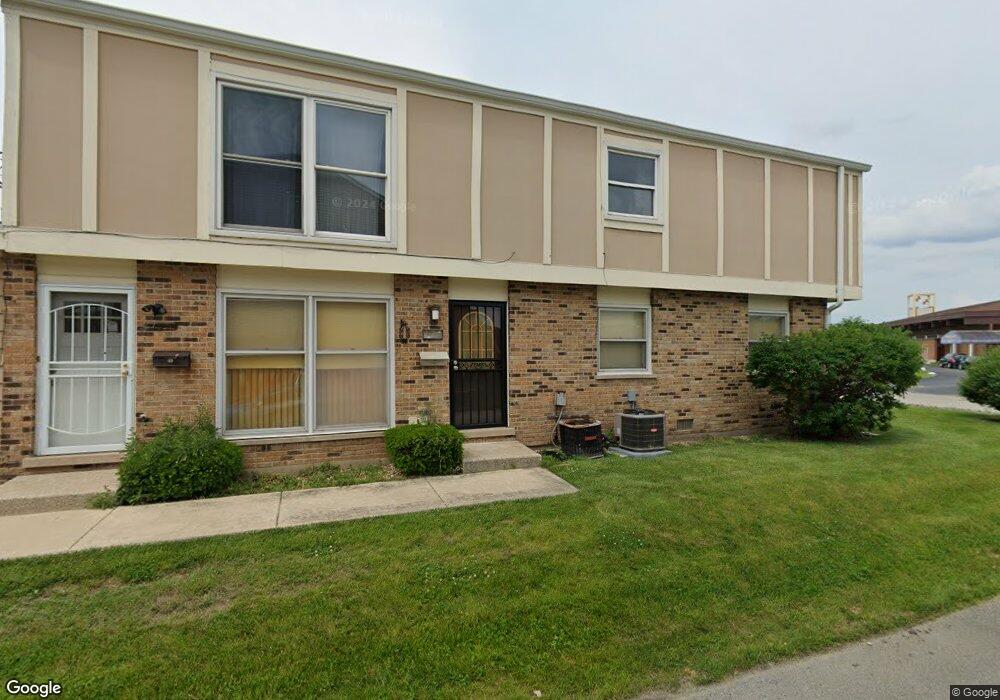
20131 Oak Ln Unit 116 Lynwood, IL 60411
Estimated Value: $98,708 - $143,000
3
Beds
1
Bath
800
Sq Ft
$150/Sq Ft
Est. Value
About This Home
This home is located at 20131 Oak Ln Unit 116, Lynwood, IL 60411 and is currently estimated at $119,677, approximately $149 per square foot. 20131 Oak Ln Unit 116 is a home located in Cook County with nearby schools including Nathan Hale Elementary School, Heritage Middle School, and Thornton Fractnl So High School.
Ownership History
Date
Name
Owned For
Owner Type
Purchase Details
Closed on
Jul 8, 2025
Sold by
Judicial Sales Corporation
Bought by
Jp Morgan Mortgage Acquisition Trust and Deutsche Bank National Trust
Current Estimated Value
Purchase Details
Closed on
Oct 11, 2017
Sold by
Dillard Carla
Bought by
Irving Monica
Purchase Details
Closed on
Apr 9, 2001
Sold by
Koontz Daniel L and Koontz Stacey
Bought by
Bryant Carla
Home Financials for this Owner
Home Financials are based on the most recent Mortgage that was taken out on this home.
Original Mortgage
$67,450
Interest Rate
7.05%
Purchase Details
Closed on
Jul 5, 1994
Sold by
Gilliam Shirley L
Bought by
Koontz Daniel L
Home Financials for this Owner
Home Financials are based on the most recent Mortgage that was taken out on this home.
Original Mortgage
$48,647
Interest Rate
8.61%
Create a Home Valuation Report for This Property
The Home Valuation Report is an in-depth analysis detailing your home's value as well as a comparison with similar homes in the area
Home Values in the Area
Average Home Value in this Area
Purchase History
| Date | Buyer | Sale Price | Title Company |
|---|---|---|---|
| Jp Morgan Mortgage Acquisition Trust | -- | None Listed On Document | |
| Irving Monica | -- | None Available | |
| Bryant Carla | $71,000 | Chicago Title Insurance Co | |
| Koontz Daniel L | $53,000 | -- |
Source: Public Records
Mortgage History
| Date | Status | Borrower | Loan Amount |
|---|---|---|---|
| Previous Owner | Bryant Carla | $67,450 | |
| Previous Owner | Koontz Daniel L | $48,647 |
Source: Public Records
Tax History Compared to Growth
Tax History
| Year | Tax Paid | Tax Assessment Tax Assessment Total Assessment is a certain percentage of the fair market value that is determined by local assessors to be the total taxable value of land and additions on the property. | Land | Improvement |
|---|---|---|---|---|
| 2024 | $700 | $5,322 | $1,376 | $3,946 |
| 2023 | $112 | $5,322 | $1,376 | $3,946 |
| 2022 | $112 | $3,656 | $1,064 | $2,592 |
| 2021 | $153 | $3,654 | $1,063 | $2,591 |
| 2020 | $244 | $3,654 | $1,063 | $2,591 |
| 2019 | $541 | $4,651 | $1,001 | $3,650 |
| 2018 | $520 | $4,651 | $1,001 | $3,650 |
| 2017 | $548 | $4,651 | $1,001 | $3,650 |
| 2016 | $682 | $4,080 | $938 | $3,142 |
| 2015 | $615 | $4,080 | $938 | $3,142 |
| 2014 | $634 | $4,080 | $938 | $3,142 |
| 2013 | $739 | $4,560 | $938 | $3,622 |
Source: Public Records
Map
Nearby Homes
- 20124 Oak Ln
- 20084 Brook Ave
- 20048 Orchard Ave
- 20152 Ash Ln Unit 1
- 20137 Woodale St Unit 161
- 2520 Cedar Glen Dr N Unit 10
- 20073 Park Ave
- 20001 Park Ave
- 19828 Monterey Ave
- 19901 Terrace Ave
- 20125 Preston Ln
- The Fairmont Plan at Wellington Court
- The Kingston Plan at Wellington Court
- The Grant Plan at Wellington Court
- The Innsbrook Plan at Wellington Court
- 20137 Preston Ln
- The Mullberry Plan at Wellington Court
- The Langston Plan at Wellington Court
- The Juniper Plan at Wellington Court
- The Hawthorn Plan at Wellington Court
- 20129 Oak Ln Unit 114
- 20127 Oak Ln Unit 113
- 20125 Oak Ln Unit 115
- 20151 Oak Ln Unit 57
- 20151 Oak Ln Unit 1
- 20119 Oak Ln Unit 109
- 20117 Oak Ln Unit 111
- 20111 Oak Ln Unit 105
- 20123 Oak Ln Unit 112
- 20115 Oak Ln Unit 106
- 20109 Oak Ln Unit 108
- 20121 Oak Ln Unit 110
- 20121 Oak Ln Unit 20121
- 20113 Oak Ln Unit 107
- 20132 Oak Ln Unit 64
- 20130 Oak Ln Unit 62
- 20128 Oak Ln Unit 61
- 20126 Oak Ln Unit 63
- 20122 Oak Ln Unit 66
- 20150 Oak Ln Unit 62