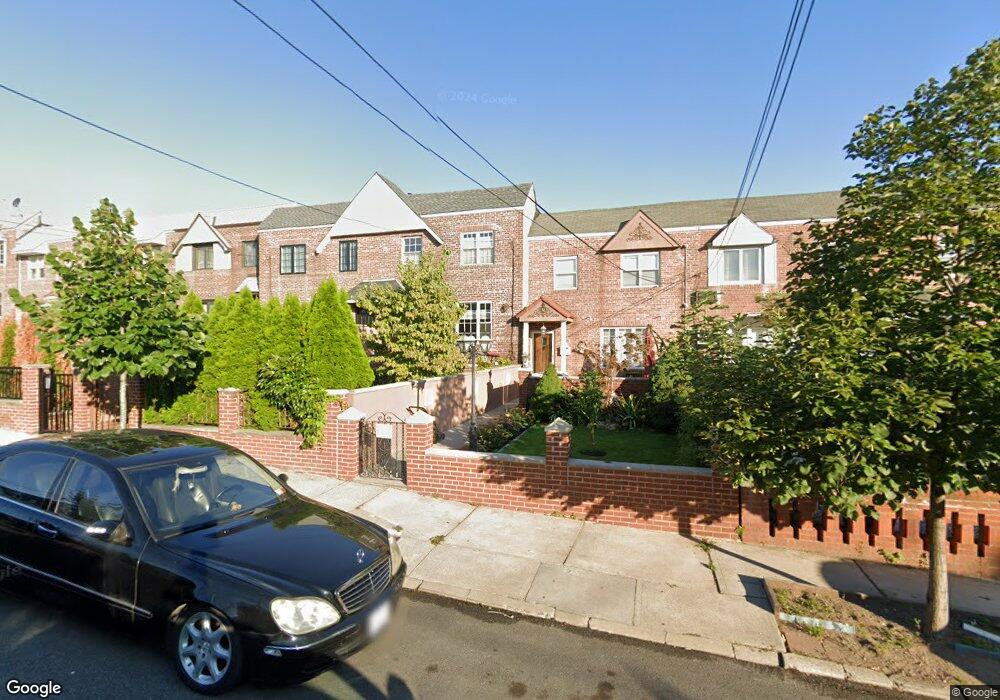
2014 43rd St Astoria, NY 11105
Ditmars Steinway NeighborhoodEstimated Value: $1,160,002 - $1,408,000
--
Bed
--
Bath
1,320
Sq Ft
$977/Sq Ft
Est. Value
About This Home
This home is located at 2014 43rd St, Astoria, NY 11105 and is currently estimated at $1,289,001, approximately $976 per square foot. 2014 43rd St is a home located in Queens County with nearby schools including P.S. 84 Steinway, Is 141 The Steinway, and William Cullen Bryant High School.
Ownership History
Date
Name
Owned For
Owner Type
Purchase Details
Closed on
Feb 15, 2012
Sold by
Yiannikouros Amy and Yiannikouros Petros
Bought by
Gilbert Schmon Lisa
Current Estimated Value
Home Financials for this Owner
Home Financials are based on the most recent Mortgage that was taken out on this home.
Original Mortgage
$430,000
Outstanding Balance
$294,170
Interest Rate
3.86%
Mortgage Type
Commercial
Estimated Equity
$994,831
Purchase Details
Closed on
Apr 7, 2009
Sold by
Custodio Santos Anazili and De Araujo Santos Lucas
Bought by
Yiannikouros Amy and Yiannikouros Petros
Home Financials for this Owner
Home Financials are based on the most recent Mortgage that was taken out on this home.
Original Mortgage
$518,545
Interest Rate
5.02%
Mortgage Type
Commercial
Purchase Details
Closed on
Dec 1, 1997
Sold by
Riabov Anne and Zaiko Paul A
Bought by
Santos Lucas Dearaujo and Santos Anazili Custodio
Home Financials for this Owner
Home Financials are based on the most recent Mortgage that was taken out on this home.
Original Mortgage
$162,000
Interest Rate
7.14%
Create a Home Valuation Report for This Property
The Home Valuation Report is an in-depth analysis detailing your home's value as well as a comparison with similar homes in the area
Home Values in the Area
Average Home Value in this Area
Purchase History
| Date | Buyer | Sale Price | Title Company |
|---|---|---|---|
| Gilbert Schmon Lisa | $780,000 | -- | |
| Yiannikouros Amy | $576,225 | -- | |
| Santos Lucas Dearaujo | $216,000 | -- |
Source: Public Records
Mortgage History
| Date | Status | Borrower | Loan Amount |
|---|---|---|---|
| Open | Gilbert Schmon Lisa | $430,000 | |
| Previous Owner | Yiannikouros Amy | $518,545 | |
| Previous Owner | Santos Lucas Dearaujo | $162,000 |
Source: Public Records
Tax History Compared to Growth
Tax History
| Year | Tax Paid | Tax Assessment Tax Assessment Total Assessment is a certain percentage of the fair market value that is determined by local assessors to be the total taxable value of land and additions on the property. | Land | Improvement |
|---|---|---|---|---|
| 2025 | $8,717 | $47,462 | $8,277 | $39,185 |
| 2024 | $8,730 | $44,803 | $8,364 | $36,439 |
| 2023 | $8,214 | $42,298 | $7,138 | $35,160 |
| 2022 | $8,157 | $70,200 | $11,280 | $58,920 |
| 2021 | $8,527 | $60,060 | $11,280 | $48,780 |
| 2020 | $8,076 | $56,760 | $11,280 | $45,480 |
| 2019 | $7,517 | $57,540 | $11,280 | $46,260 |
| 2018 | $6,888 | $35,248 | $6,041 | $29,207 |
| 2017 | $6,886 | $35,248 | $7,102 | $28,146 |
| 2016 | $6,674 | $35,248 | $7,102 | $28,146 |
| 2015 | $3,791 | $32,960 | $8,831 | $24,129 |
| 2014 | $3,791 | $31,114 | $9,838 | $21,276 |
Source: Public Records
Map
Nearby Homes
- 2009 42nd St
- 41-05 20th Ave
- 20-61 42nd St
- 2064 46th St
- 20-08 Steinway St Unit 303
- 20-08 Steinway St Unit 208
- 20-08 Steinway St Unit 204
- 20-08 Steinway St Unit 203
- 20-08 Steinway St Unit 404
- 20-08 Steinway St Unit 308
- 20-08 Steinway St Unit 307
- 20-08 Steinway St Unit 305
- 20-08 Steinway St Unit 101
- 20-08 Steinway St Unit 406
- 20-08 Steinway St Unit 402
- 20-08 Steinway St Unit 207
- 20-08 Steinway St Unit 205
- 20-08 Steinway St Unit 304
- 43-14 21st Ave
- 2036 47th St