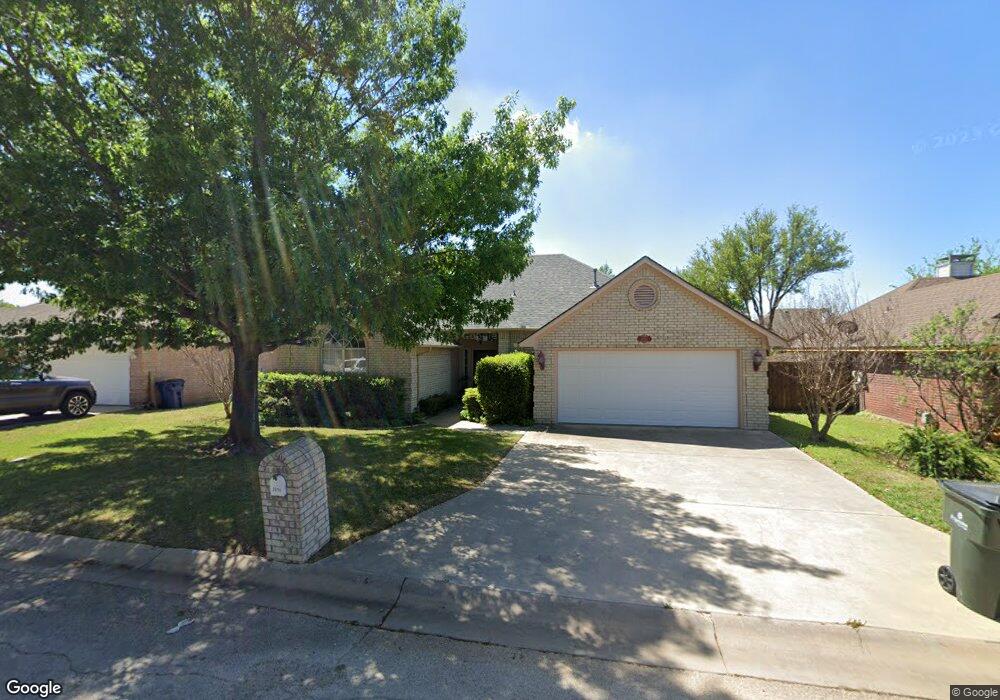
2014 Brooke Dr Sanger, TX 76266
Estimated Value: $284,737 - $319,000
3
Beds
2
Baths
1,578
Sq Ft
$191/Sq Ft
Est. Value
About This Home
This home is located at 2014 Brooke Dr, Sanger, TX 76266 and is currently estimated at $301,684, approximately $191 per square foot. 2014 Brooke Dr is a home located in Denton County with nearby schools including Chisholm Trail Elementary School, Clear Creek Intermediate School, and Sanger Middle School.
Ownership History
Date
Name
Owned For
Owner Type
Purchase Details
Closed on
Oct 24, 2018
Sold by
Scholl Brenda Ann
Bought by
Licare Deborah Lynn and Grant Dana Michele
Current Estimated Value
Purchase Details
Closed on
Sep 5, 2008
Sold by
Hall Michael
Bought by
Scholl Brenda
Purchase Details
Closed on
Sep 24, 2003
Sold by
Sundquist David and Sundquist Christine
Bought by
Hall Michael
Home Financials for this Owner
Home Financials are based on the most recent Mortgage that was taken out on this home.
Original Mortgage
$91,500
Interest Rate
6.22%
Mortgage Type
Purchase Money Mortgage
Purchase Details
Closed on
Oct 5, 2001
Sold by
Looper Enterprises Inc
Bought by
Sundquist David
Home Financials for this Owner
Home Financials are based on the most recent Mortgage that was taken out on this home.
Original Mortgage
$82,500
Interest Rate
6.88%
Create a Home Valuation Report for This Property
The Home Valuation Report is an in-depth analysis detailing your home's value as well as a comparison with similar homes in the area
Home Values in the Area
Average Home Value in this Area
Purchase History
| Date | Buyer | Sale Price | Title Company |
|---|---|---|---|
| Licare Deborah Lynn | -- | None Available | |
| Scholl Brenda | -- | Hftc | |
| Hall Michael | -- | -- | |
| Sundquist David | -- | -- |
Source: Public Records
Mortgage History
| Date | Status | Borrower | Loan Amount |
|---|---|---|---|
| Previous Owner | Hall Michael | $91,500 | |
| Previous Owner | Sundquist David | $82,500 |
Source: Public Records
Tax History
| Year | Tax Paid | Tax Assessment Tax Assessment Total Assessment is a certain percentage of the fair market value that is determined by local assessors to be the total taxable value of land and additions on the property. | Land | Improvement |
|---|---|---|---|---|
| 2025 | $2,062 | $311,041 | $62,400 | $261,739 |
| 2024 | $5,715 | $282,765 | $0 | $0 |
| 2023 | $1,884 | $257,059 | $62,400 | $257,079 |
| 2022 | $5,182 | $233,690 | $53,040 | $227,618 |
| 2021 | $4,465 | $212,445 | $31,824 | $180,621 |
| 2020 | $4,622 | $208,904 | $31,824 | $177,080 |
| 2019 | $4,467 | $196,208 | $31,824 | $169,521 |
| 2018 | $4,083 | $178,371 | $31,824 | $146,547 |
| 2017 | $3,802 | $165,309 | $31,824 | $133,505 |
| 2016 | $3,456 | $150,281 | $19,344 | $130,937 |
| 2015 | $2,084 | $139,467 | $19,344 | $120,123 |
| 2013 | -- | $118,765 | $19,344 | $99,421 |
Source: Public Records
Map
Nearby Homes
- 2029 Laney Dr
- 701 Keaton Rd S Unit S
- 821 Jennifer Ct
- 1804 Sand Stone Dr
- 2501 Caddo Trail
- 820 N Tejas Dr
- 411 Hughes St
- 1149 Serendipity Cir
- 1209 Bolivar St
- Tbd I35
- 141 Shady Grove Dr
- 412 N 10th St
- TBD Church St
- Tbd Church St
- 4063 Farm To Market 455 W
- 1001 Hunters Ct
- 113 Diane Dr
- 612 N 10th St
- 710 W Willow St
- 4551 Farm To Market Road 455
Your Personal Tour Guide
Ask me questions while you tour the home.