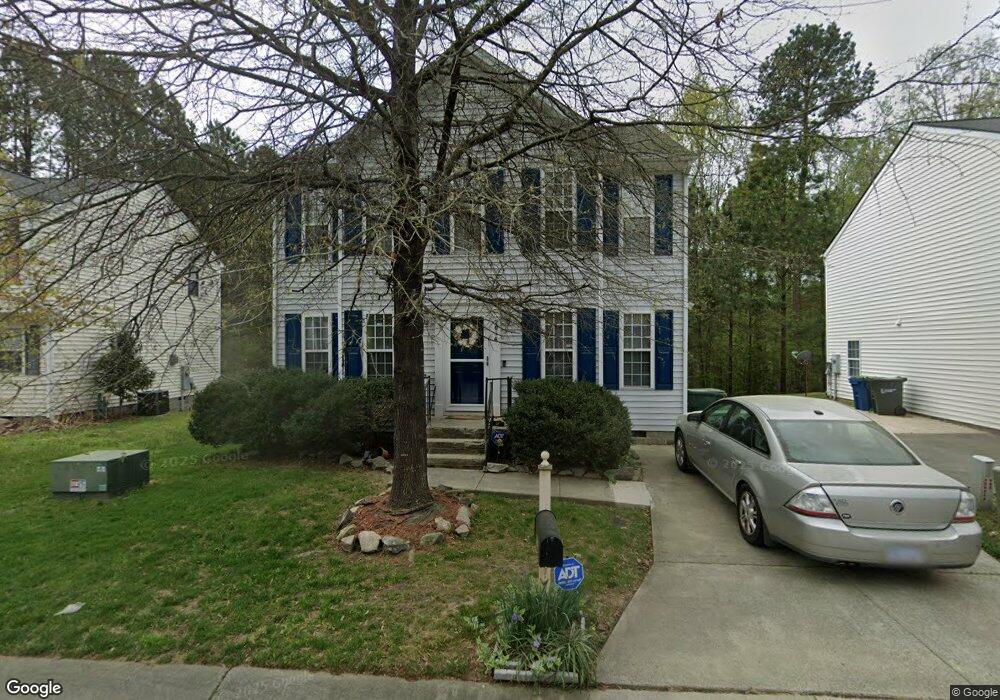
2014 Buffalo Way Durham, NC 27704
Northeast Durham NeighborhoodEstimated Value: $298,000 - $323,000
3
Beds
3
Baths
1,632
Sq Ft
$191/Sq Ft
Est. Value
About This Home
This home is located at 2014 Buffalo Way, Durham, NC 27704 and is currently estimated at $310,988, approximately $190 per square foot. 2014 Buffalo Way is a home located in Durham County with nearby schools including Merrick-Moore Elementary School, John W Neal Middle School, and Southern School of Energy & Sustainability.
Ownership History
Date
Name
Owned For
Owner Type
Purchase Details
Closed on
Jun 21, 2005
Sold by
Federal National Mortgage Association
Bought by
Brown Mamie Susan
Current Estimated Value
Home Financials for this Owner
Home Financials are based on the most recent Mortgage that was taken out on this home.
Original Mortgage
$104,800
Outstanding Balance
$58,561
Interest Rate
6.87%
Mortgage Type
Fannie Mae Freddie Mac
Estimated Equity
$252,427
Purchase Details
Closed on
Feb 8, 2005
Sold by
Fleming Kelvin B and Fleming Angela Pringle
Bought by
Federal National Mortgage Association
Purchase Details
Closed on
Feb 5, 2003
Sold by
Anderson Homes Inc
Bought by
Fleming Kelvin B and Fleming Angela Pringle
Home Financials for this Owner
Home Financials are based on the most recent Mortgage that was taken out on this home.
Original Mortgage
$131,850
Interest Rate
5.93%
Create a Home Valuation Report for This Property
The Home Valuation Report is an in-depth analysis detailing your home's value as well as a comparison with similar homes in the area
Home Values in the Area
Average Home Value in this Area
Purchase History
We collect this data history from publicly available records. To have your information removed, we recommend requesting removal directly through your county’s website.
| Date | Buyer | Sale Price | Title Company |
|---|---|---|---|
| Brown Mamie Susan | -- | -- | |
| Federal National Mortgage Association | $140,582 | -- | |
| Fleming Kelvin B | $135,000 | -- |
Source: Public Records
Mortgage History
We collect this data history from publicly available records. To have your information removed, we recommend requesting removal directly through your county’s website.
| Date | Status | Borrower | Loan Amount |
|---|---|---|---|
| Open | Brown Mamie Susan | $104,800 | |
| Previous Owner | Fleming Kelvin B | $131,850 |
Source: Public Records
Tax History
| Year | Tax Paid | Tax Assessment Tax Assessment Total Assessment is a certain percentage of the fair market value that is determined by local assessors to be the total taxable value of land and additions on the property. | Land | Improvement |
|---|---|---|---|---|
| 2025 | $3,150 | $317,803 | $70,625 | $247,178 |
| 2024 | $2,030 | $145,524 | $22,500 | $123,024 |
| 2023 | $1,906 | $145,524 | $22,500 | $123,024 |
| 2022 | $1,863 | $145,524 | $22,500 | $123,024 |
| 2021 | $1,854 | $145,524 | $22,500 | $123,024 |
| 2020 | $1,810 | $145,524 | $22,500 | $123,024 |
| 2019 | $1,810 | $145,524 | $22,500 | $123,024 |
| 2018 | $1,754 | $129,329 | $25,312 | $104,017 |
| 2017 | $1,741 | $129,329 | $25,312 | $104,017 |
| 2016 | $1,683 | $129,329 | $25,312 | $104,017 |
| 2015 | $1,940 | $140,137 | $24,200 | $115,937 |
| 2014 | $1,940 | $140,137 | $24,200 | $115,937 |
Source: Public Records
Map
Nearby Homes
- 2027 Buffalo Way
- 1917 Milan St
- 1615 Great Bend Dr
- 1905 Spring Creek Dr
- 1905 Landon Farms Ln
- 1732 Great Bend Dr
- 2505 Winburn Ave
- 2206 E Club Blvd
- 2234 Crestwood Ridge Dr
- 2021 Bull City Bend Unit 392
- 2040 Feather Rock Dr
- 1029 Ringhill Bluff Dr
- 2129 Crestwood Ridge Dr
- 1041 Ringhill Bluff Dr
- 2112 Crestwood Ridge Dr
- 1111 Midland Terrace
- 2212 Feather Rock Dr
- 1401 Milan St
- 2210 Rabbitbrush St
- 3017 Chrys St
- 2016 Buffalo Way
- 2012 Buffalo Way
- 2018 Buffalo Way
- 2010 Buffalo Way
- 2015 Buffalo Way
- 2020 Buffalo Way
- 2011 Buffalo Way
- 2017 Buffalo Way
- 2008 Buffalo Way
- 2019 Buffalo Way
- 2007 Buffalo Way
- 2022 Buffalo Way
- 2006 Buffalo Way
- 2021 Buffalo Way
- 2003 Buffalo Way
- 2004 Lime St
- 1504 Great Bend Dr
- 1933 E Geer St
- 2023 Buffalo Way
- 2004 Buffalo Way
Your Personal Tour Guide
Ask me questions while you tour the home.