2014 E Hopi Ln Mount Prospect, IL 60056
Forest River NeighborhoodEstimated Value: $487,000 - $584,000
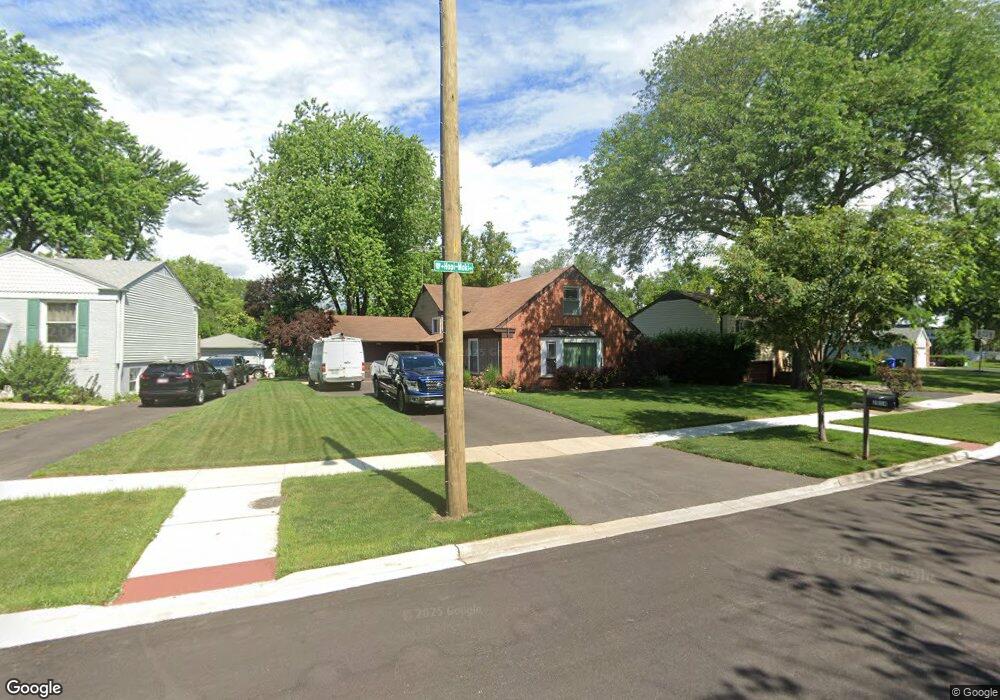
About This Home
This home is located at 2014 E Hopi Ln, Mount Prospect, IL 60056 and is currently estimated at $529,722, approximately $418 per square foot. 2014 E Hopi Ln is a home located in Cook County with nearby schools including Indian Grove Elementary School, River Trails Middle School, and John Hersey High School.
Ownership History
We collect this data history from publicly available records. To have your information removed, we recommend requesting removal directly through your county’s website.
Purchase Details
Home Financials for this Owner
Home Financials are based on the most recent Mortgage that was taken out on this home.Purchase Details
Home Financials for this Owner
Home Financials are based on the most recent Mortgage that was taken out on this home.Purchase Details
Home Values in the Area
Average Home Value in this Area
Purchase History
We collect this data history from publicly available records. To have your information removed, we recommend requesting removal directly through your county’s website.
| Date | Buyer | Sale Price | Title Company |
|---|---|---|---|
| -- | First American Title Insuran | ||
| $335,000 | Multiple | ||
| -- | -- |
Mortgage History
We collect this data history from publicly available records. To have your information removed, we recommend requesting removal directly through your county’s website.
| Date | Status | Borrower | Loan Amount |
|---|---|---|---|
| Open | $319,600 | ||
| Previous Owner | $268,000 |
Tax History
We collect this data history from publicly available records. To have your information removed, we recommend requesting removal directly through your county’s website.
| Year | Tax Paid | Tax Assessment Tax Assessment Total Assessment is a certain percentage of the fair market value that is determined by local assessors to be the total taxable value of land and additions on the property. | Land | Improvement |
|---|---|---|---|---|
| 2025 | $9,212 | $43,000 | $11,059 | $31,941 |
| 2024 | $9,212 | $34,000 | $9,479 | $24,521 |
| 2023 | $8,808 | $34,000 | $9,479 | $24,521 |
| 2022 | $8,808 | $34,000 | $9,479 | $24,521 |
| 2021 | $8,825 | $29,926 | $6,055 | $23,871 |
| 2020 | $8,600 | $29,926 | $6,055 | $23,871 |
| 2019 | $8,633 | $33,363 | $6,055 | $27,308 |
| 2018 | $7,941 | $28,129 | $5,266 | $22,863 |
| 2017 | $7,890 | $28,129 | $5,266 | $22,863 |
| 2016 | $7,664 | $28,129 | $5,266 | $22,863 |
| 2015 | $6,487 | $22,568 | $4,476 | $18,092 |
| 2014 | $6,945 | $24,270 | $4,476 | $19,794 |
| 2013 | $6,759 | $24,270 | $4,476 | $19,794 |
Map
- 1917 E Cholo Ln
- 1450 N River Rd
- 2018 E Ivy Ln
- 1903 E Ivy Ln
- 1829 E Bittersweet Ln
- 1203 N Burning Bush Ln
- 219 River Front Dr
- 1811 Azalea Ln
- 221 N Graylynn Dr
- 134 E Morrison Ave
- 1351 Callen Ln
- 1311 Callen Ln
- 1631 E Greenwood Dr
- 1411 N Burning Bush Ln Unit 1
- 1413 N Burning Bush Ln
- 1331 N Indigo Dr
- 1626 E Barberry Ln
- 1503 N Park Dr
- 1742 E Tano Ln
- 1645 Forest Dr
Ask me questions while you tour the home.