M
Seller's Agent in 2022
Mary Humphrey
Humphrey Real Properties LLC
1 in this area
15 Total Sales


Estimated Value: $242,000 - $265,000
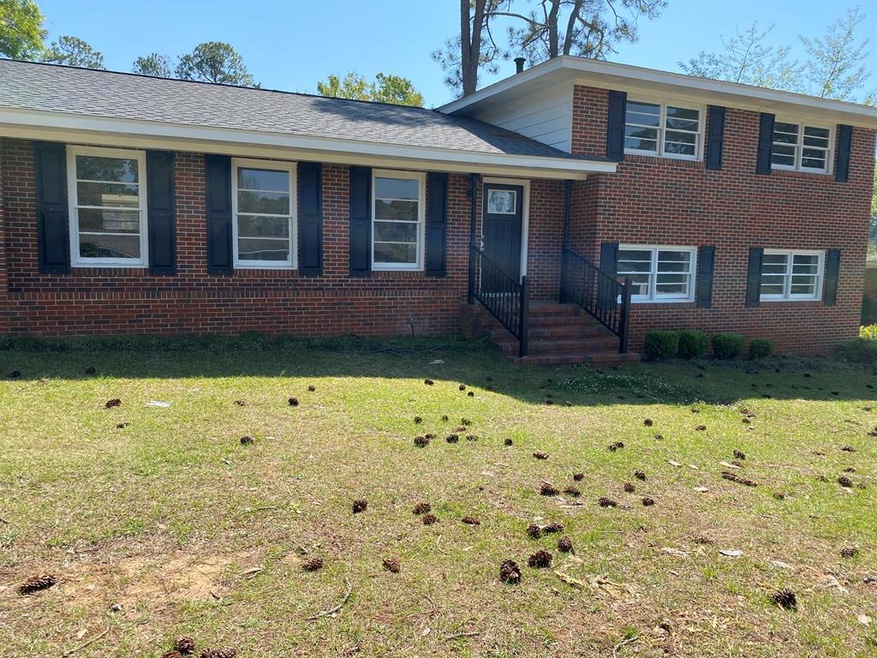
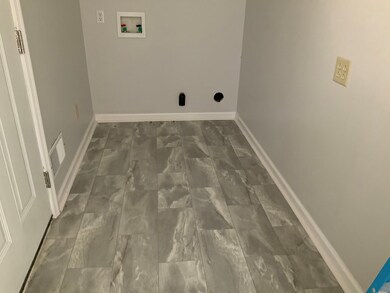
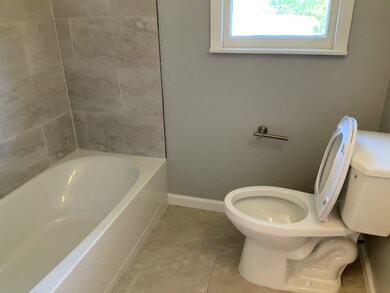
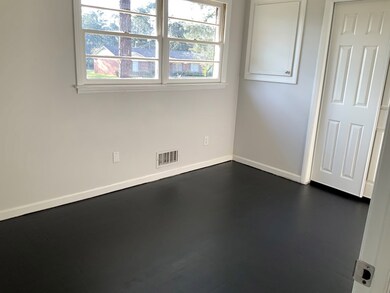
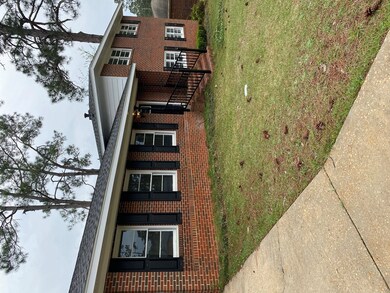
Beautiful home located in the lake park nears shopping schools and Dr offices. 5 bedrooms 3 full baths half bath located in the pool house. Lots of bright windows kitchen, beautiful formal dinning room, living room and den. Hardwood floors on the upper level in master suite and two bedrooms. Home has been totally remodel with all new flooring, new heating and cooling system, update wiring, remodel all baths with built in showers. The lower level has two bedrooms and a bonus room. On a hot summer day go for a swim in your own pool. This home includes a pool house with half bath included. Privacy fence in around back yard.
Last Agent to Sell the Property
Humphrey Real Properties LLC Brokerage Phone: 2293470664 License #270510 Listed on: 03/31/2022
Last Buyer's Agent
Humphrey Real Properties LLC Brokerage Phone: 2293470664 License #270510 Listed on: 03/31/2022
| Date | Buyer | Sale Price | Title Company |
|---|---|---|---|
| Williams Derrick R | $215,000 | -- | |
| Nek Restaurant Holdings Llc | $72,600 | -- | |
| Radcliffe Mary Laura | $169,000 | -- | |
| Cooper Marion T | $110,000 | -- | |
| Henderson Susan E | $105,000 | -- | |
| Andriate Gary | -- | -- |
| Date | Status | Borrower | Loan Amount |
|---|---|---|---|
| Open | Williams Derrick R | $211,105 | |
| Previous Owner | Radcliffe Mary Laura | $166,388 |
| Date | Event | Price | List to Sale | Price per Sq Ft |
|---|---|---|---|---|
| 04/08/2022 04/08/22 | Sold | $215,000 | -- | $89 / Sq Ft |
| 03/31/2022 03/31/22 | Pending | -- | -- | -- |
| Year | Tax Paid | Tax Assessment Tax Assessment Total Assessment is a certain percentage of the fair market value that is determined by local assessors to be the total taxable value of land and additions on the property. | Land | Improvement |
|---|---|---|---|---|
| 2024 | $2,948 | $61,796 | $9,360 | $52,436 |
| 2023 | $2,879 | $61,796 | $9,360 | $52,436 |
| 2022 | $2,890 | $61,796 | $9,360 | $52,436 |
| 2021 | $2,679 | $61,796 | $9,360 | $52,436 |
| 2020 | $2,685 | $61,796 | $9,360 | $52,436 |
| 2019 | $2,676 | $61,356 | $9,360 | $51,996 |
| 2018 | $2,688 | $61,356 | $9,360 | $51,996 |
| 2017 | $2,504 | $61,356 | $9,360 | $51,996 |
| 2016 | $2,505 | $61,356 | $9,360 | $51,996 |
| 2015 | $2,512 | $61,356 | $9,360 | $51,996 |
| 2014 | $2,574 | $63,676 | $11,680 | $51,996 |
M
Seller's Agent in 2022
Mary Humphrey
Humphrey Real Properties LLC
1 in this area
15 Total Sales
Source: Albany Board of REALTORS®
MLS Number: 149866
APN: 0000P-00010-003
