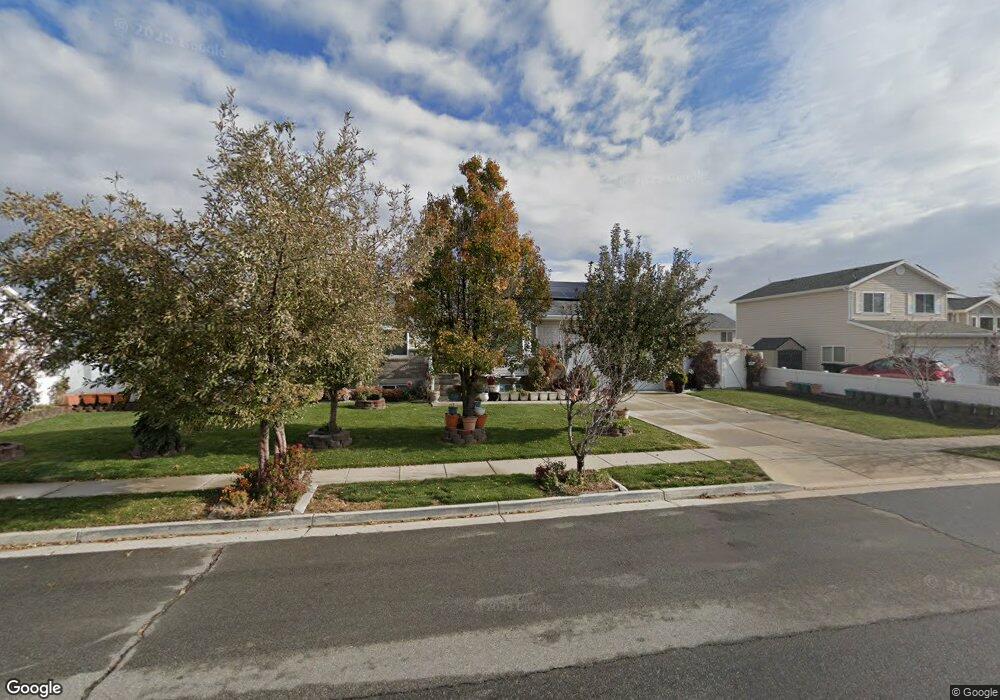
2014 N 1450 W Clearfield, UT 84015
Estimated Value: $434,000 - $471,000
3
Beds
2
Baths
1,274
Sq Ft
$356/Sq Ft
Est. Value
About This Home
This home is located at 2014 N 1450 W, Clearfield, UT 84015 and is currently estimated at $453,957, approximately $356 per square foot. 2014 N 1450 W is a home located in Davis County with nearby schools including Parkside Elementary School, Sunset Junior High School, and Clearfield High School.
Ownership History
Date
Name
Owned For
Owner Type
Purchase Details
Closed on
Sep 10, 2019
Sold by
Orenyak Daniel G and Orenyak Matilda S
Bought by
Orenyak Daniel G and Orenyak Matilda S
Current Estimated Value
Purchase Details
Closed on
Nov 2, 2007
Sold by
Orenyak Daniel G and Orenyak Matilda S
Bought by
Orenyak Daniel G and Orenyak Matilda S
Purchase Details
Closed on
Sep 1, 2002
Sold by
Dhi Builders Llc
Bought by
Orenyak Daniel G and Orenyak Matilda S
Home Financials for this Owner
Home Financials are based on the most recent Mortgage that was taken out on this home.
Original Mortgage
$160,383
Outstanding Balance
$65,970
Interest Rate
6.16%
Mortgage Type
FHA
Estimated Equity
$387,987
Create a Home Valuation Report for This Property
The Home Valuation Report is an in-depth analysis detailing your home's value as well as a comparison with similar homes in the area
Home Values in the Area
Average Home Value in this Area
Purchase History
| Date | Buyer | Sale Price | Title Company |
|---|---|---|---|
| Orenyak Daniel G | -- | None Available | |
| Orenyak Daniel G | -- | None Available | |
| Orenyak Daniel G | -- | Equity Title Agency | |
| Dhi Builders Llc | -- | Equity Title Agency |
Source: Public Records
Mortgage History
| Date | Status | Borrower | Loan Amount |
|---|---|---|---|
| Open | Orenyak Daniel G | $160,383 |
Source: Public Records
Tax History Compared to Growth
Tax History
| Year | Tax Paid | Tax Assessment Tax Assessment Total Assessment is a certain percentage of the fair market value that is determined by local assessors to be the total taxable value of land and additions on the property. | Land | Improvement |
|---|---|---|---|---|
| 2025 | $1,923 | $237,050 | $92,179 | $144,871 |
| 2024 | $1,844 | $228,800 | $101,135 | $127,665 |
| 2023 | $1,682 | $388,000 | $115,398 | $272,602 |
| 2022 | $2,148 | $240,900 | $70,185 | $170,715 |
| 2021 | $1,900 | $329,000 | $88,547 | $240,453 |
| 2020 | $1,615 | $284,000 | $75,603 | $208,397 |
| 2019 | $1,568 | $271,000 | $87,675 | $183,325 |
| 2018 | $1,418 | $245,000 | $73,966 | $171,034 |
| 2016 | $1,506 | $108,405 | $28,879 | $79,526 |
| 2015 | $1,454 | $99,495 | $28,879 | $70,616 |
| 2014 | $1,399 | $97,263 | $28,879 | $68,384 |
| 2013 | -- | $91,476 | $27,143 | $64,333 |
Source: Public Records
Map
Nearby Homes