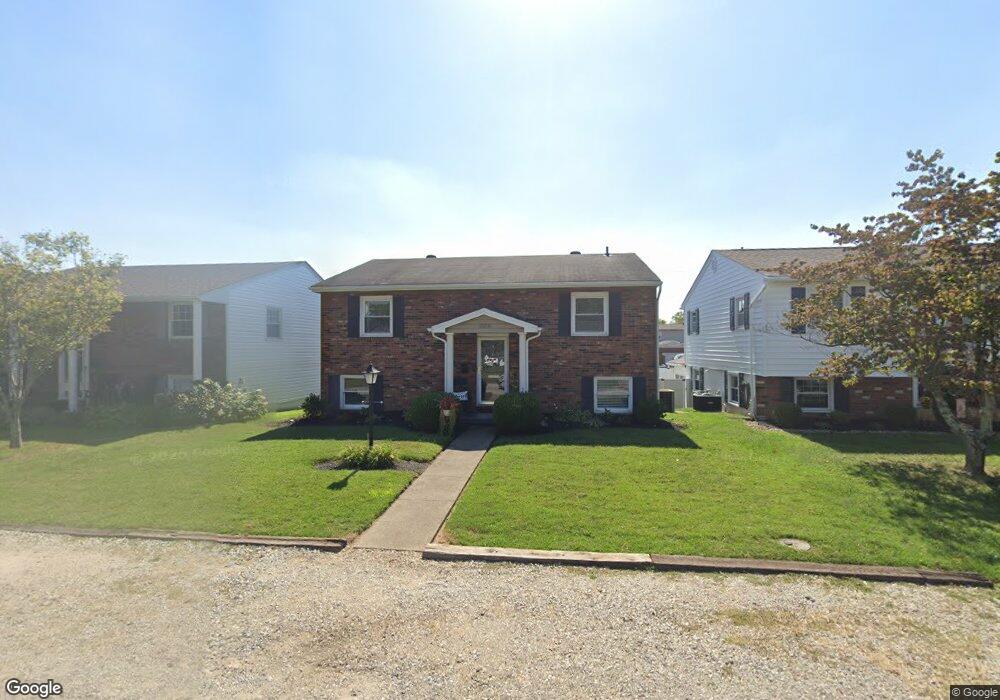
2014 N 3rd St Ironton, OH 45638
Estimated Value: $138,000 - $143,361
3
Beds
2
Baths
952
Sq Ft
$148/Sq Ft
Est. Value
About This Home
This home is located at 2014 N 3rd St, Ironton, OH 45638 and is currently estimated at $141,340, approximately $148 per square foot. 2014 N 3rd St is a home located in Lawrence County with nearby schools including Ironton Elementary School, Ironton Middle School, and Ironton High School.
Ownership History
Date
Name
Owned For
Owner Type
Purchase Details
Closed on
Sep 12, 2008
Sold by
Layne Heather M and Layne Brian
Bought by
Stuntebeck Matthew
Current Estimated Value
Purchase Details
Closed on
Feb 19, 2004
Sold by
Cendant Mobility Financia
Bought by
Stuntebeck Matthew
Purchase Details
Closed on
Nov 26, 2003
Sold by
Donahue Kevin A and Donahue Jenni
Bought by
Cendant Mobility Financia
Purchase Details
Closed on
Oct 2, 1996
Sold by
Long Lynda M and Long Betty B
Bought by
Donahue Kevin A and Donahue Jenni
Purchase Details
Closed on
May 13, 1996
Sold by
Meyers Paul E
Bought by
Long Lynda M and Long Betty B
Purchase Details
Closed on
Apr 12, 1996
Sold by
Meyers Elizabeth
Bought by
Meyers Paul E
Create a Home Valuation Report for This Property
The Home Valuation Report is an in-depth analysis detailing your home's value as well as a comparison with similar homes in the area
Home Values in the Area
Average Home Value in this Area
Purchase History
| Date | Buyer | Sale Price | Title Company |
|---|---|---|---|
| Stuntebeck Matthew | $20,000 | Attorney | |
| Stuntebeck Matthew | $95,000 | -- | |
| Cendant Mobility Financia | $104,300 | -- | |
| Donahue Kevin A | $78,000 | -- | |
| Long Lynda M | -- | -- | |
| Meyers Paul E | -- | -- |
Source: Public Records
Tax History Compared to Growth
Tax History
| Year | Tax Paid | Tax Assessment Tax Assessment Total Assessment is a certain percentage of the fair market value that is determined by local assessors to be the total taxable value of land and additions on the property. | Land | Improvement |
|---|---|---|---|---|
| 2024 | -- | $34,590 | $4,240 | $30,350 |
| 2023 | $1,247 | $34,590 | $4,240 | $30,350 |
| 2022 | $1,245 | $34,590 | $4,240 | $30,350 |
| 2021 | $1,219 | $32,450 | $3,540 | $28,910 |
| 2020 | $1,235 | $32,450 | $3,540 | $28,910 |
| 2019 | $1,230 | $32,450 | $3,540 | $28,910 |
| 2018 | $1,132 | $29,500 | $3,220 | $26,280 |
| 2017 | $502 | $29,500 | $3,220 | $26,280 |
| 2016 | $1,060 | $29,500 | $3,220 | $26,280 |
| 2015 | $1,035 | $27,790 | $3,540 | $24,250 |
| 2014 | $999 | $27,790 | $3,540 | $24,250 |
| 2013 | $996 | $27,790 | $3,540 | $24,250 |
Source: Public Records
Map
Nearby Homes