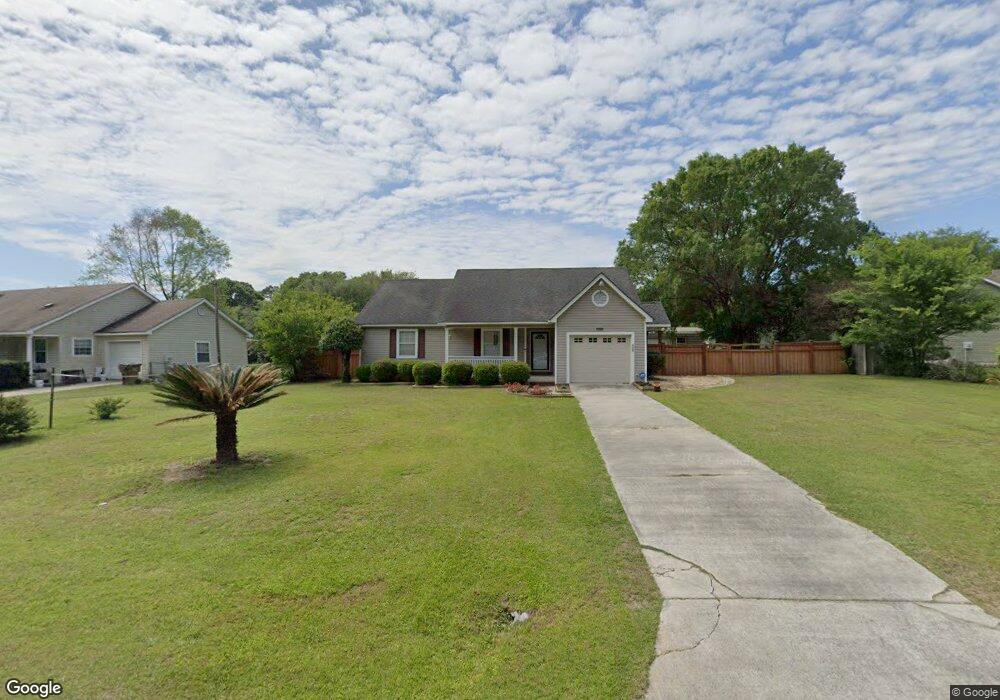
2014 Oriole Way Tifton, GA 31793
Estimated Value: $256,816 - $271,000
3
Beds
2
Baths
1,295
Sq Ft
$205/Sq Ft
Est. Value
About This Home
This home is located at 2014 Oriole Way, Tifton, GA 31793 and is currently estimated at $265,704, approximately $205 per square foot. 2014 Oriole Way is a home located in Tift County with nearby schools including Annie Belle Clark Primary School, Matt Wilson Elementary School, and J.T. Reddick School.
Ownership History
Date
Name
Owned For
Owner Type
Purchase Details
Closed on
Jun 6, 2025
Sold by
Mai Van T
Bought by
Mai Van T and Nguyen Nhan The
Current Estimated Value
Purchase Details
Closed on
Mar 2, 2016
Sold by
Haraten Matthew G
Bought by
Mai Van T
Purchase Details
Closed on
Mar 15, 2010
Sold by
Solomon Calvin L
Bought by
Haraten Matthew G and Harten Kari
Home Financials for this Owner
Home Financials are based on the most recent Mortgage that was taken out on this home.
Original Mortgage
$89,795
Interest Rate
4.93%
Mortgage Type
New Conventional
Purchase Details
Closed on
Jul 24, 2003
Sold by
First Community Bank Of Tifton
Bought by
Solomon Calvin L and Solomon Shonda P
Purchase Details
Closed on
Jan 7, 2003
Sold by
Fallenderronald G 7 Ann K
Bought by
First Community Bank Of Tifton
Purchase Details
Closed on
Jul 30, 1992
Bought by
Fallender Ronald G
Create a Home Valuation Report for This Property
The Home Valuation Report is an in-depth analysis detailing your home's value as well as a comparison with similar homes in the area
Home Values in the Area
Average Home Value in this Area
Purchase History
| Date | Buyer | Sale Price | Title Company |
|---|---|---|---|
| Mai Van T | $100 | -- | |
| Mai Van T | $100,000 | -- | |
| Haraten Matthew G | $88,000 | -- | |
| Solomon Calvin L | $71,800 | -- | |
| First Community Bank Of Tifton | $28,100 | -- | |
| Fallender Ronald G | $64,000 | -- |
Source: Public Records
Mortgage History
| Date | Status | Borrower | Loan Amount |
|---|---|---|---|
| Previous Owner | Haraten Matthew G | $89,795 |
Source: Public Records
Tax History Compared to Growth
Tax History
| Year | Tax Paid | Tax Assessment Tax Assessment Total Assessment is a certain percentage of the fair market value that is determined by local assessors to be the total taxable value of land and additions on the property. | Land | Improvement |
|---|---|---|---|---|
| 2024 | $2,504 | $116,752 | $8,000 | $108,752 |
| 2023 | $2,720 | $38,984 | $3,400 | $35,584 |
| 2022 | $1,098 | $38,984 | $3,400 | $35,584 |
| 2021 | $1,104 | $38,984 | $3,400 | $35,584 |
| 2020 | $1,125 | $38,984 | $3,400 | $35,584 |
| 2019 | $1,123 | $38,984 | $3,400 | $35,584 |
| 2018 | $1,121 | $38,984 | $3,400 | $35,584 |
| 2017 | $947 | $33,102 | $3,400 | $29,702 |
| 2016 | $1,009 | $33,102 | $3,400 | $29,702 |
| 2015 | $1,010 | $33,102 | $3,400 | $29,702 |
| 2014 | $1,012 | $33,102 | $3,400 | $29,702 |
| 2013 | -- | $30,192 | $3,400 | $26,792 |
Source: Public Records
Map
Nearby Homes
- 4104 London Ln
- 1802 Golden Rd W
- 0 Deer Run Cir
- 4502 Carpenter Rd S
- 64 Palmetta Rd
- 0 S Carpenter Rd
- 4554 Carpenter Rd S
- 100 Palmetta Rd
- 27 Water's Edge Way
- 53 Waters Edge Way
- 17 Waters Edge Way
- 54 Jacks Way
- 111 Virginia Ave
- 604 Golden Rd W
- 614/620 Old Omega Rd
- 1802 U S Highway 82
- 33 Surrey Cir
- 0 Carpenter Rd
- 0 Jordan Rd
- 45 Surrey Cir
- 2018 Oriole Way
- 3503 Oriole Ct
- 2012 Oriole Way
- 2020 Oriole Way Unit 12
- 2020 Oriole Way
- 2019 Oriole Way
- 2017 Oriole Way
- 3505 Oriole Ct
- 2008 Oriole Way
- 2015 Oriole Way
- 2022 Oriole Way
- 2011 Oriole Way
- 2013 Oriole Way
- 2004 Oriole Way
- 3504 Oriole Ct
- 2009 Oriole Way
- 2024 Oriole Way
- 3506 Oriole Ct
- 2007 Oriole Way
- 2021 Oriole Way