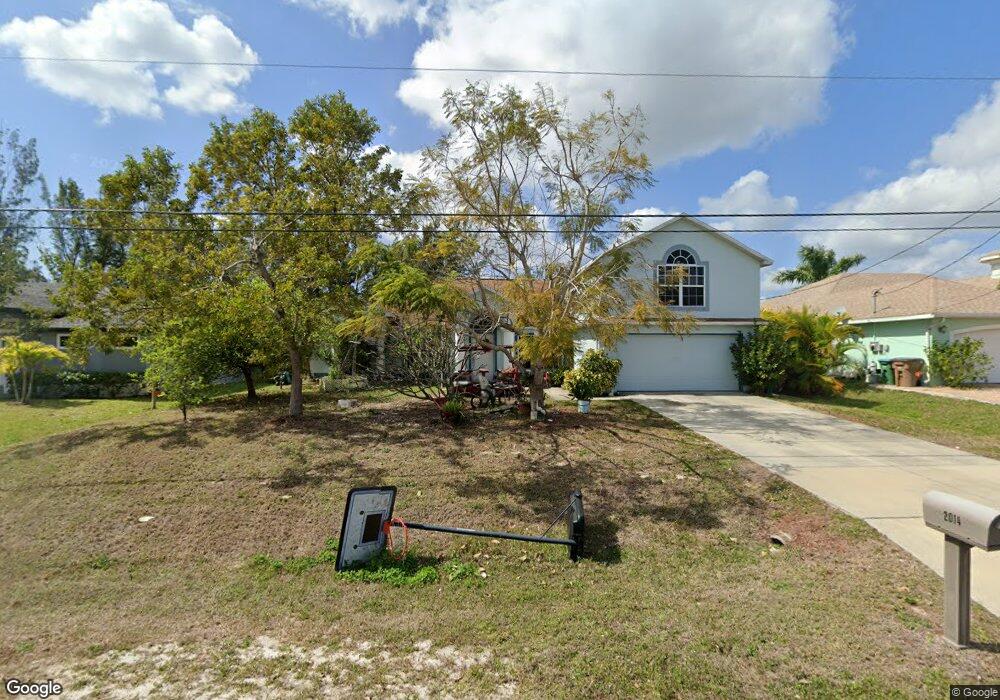
2014 SW 17th Ave Cape Coral, FL 33991
Trafalgar NeighborhoodEstimated Value: $465,000 - $706,000
5
Beds
3
Baths
358
Sq Ft
$1,658/Sq Ft
Est. Value
About This Home
This home is located at 2014 SW 17th Ave, Cape Coral, FL 33991 and is currently estimated at $593,548, approximately $1,657 per square foot. 2014 SW 17th Ave is a home located in Lee County with nearby schools including Caloosa Elementary School, Cape Elementary School, and Tropic Isles Elementary School.
Ownership History
Date
Name
Owned For
Owner Type
Purchase Details
Closed on
Nov 6, 2009
Sold by
Kight Toby
Bought by
Kight Carrie
Current Estimated Value
Purchase Details
Closed on
Feb 11, 2005
Sold by
Mckelvey Douglas H and Mckelvey Glenna L
Bought by
Kight Toby and Kight Carrie
Home Financials for this Owner
Home Financials are based on the most recent Mortgage that was taken out on this home.
Original Mortgage
$156,000
Outstanding Balance
$78,561
Interest Rate
5.61%
Mortgage Type
New Conventional
Estimated Equity
$514,987
Purchase Details
Closed on
Dec 23, 2003
Sold by
Mercedes Homes Inc
Bought by
Mckelvey Douglas H and Mckelvey Glenna L
Home Financials for this Owner
Home Financials are based on the most recent Mortgage that was taken out on this home.
Original Mortgage
$277,380
Interest Rate
6.05%
Purchase Details
Closed on
May 22, 2002
Sold by
Rivera Katheryn C
Bought by
Merceces Homes
Create a Home Valuation Report for This Property
The Home Valuation Report is an in-depth analysis detailing your home's value as well as a comparison with similar homes in the area
Home Values in the Area
Average Home Value in this Area
Purchase History
| Date | Buyer | Sale Price | Title Company |
|---|---|---|---|
| Kight Carrie | -- | Attorney | |
| Kight Toby | $418,000 | Jm Title Corporation | |
| Mckelvey Douglas H | $309,100 | -- | |
| Merceces Homes | $35,000 | -- |
Source: Public Records
Mortgage History
| Date | Status | Borrower | Loan Amount |
|---|---|---|---|
| Open | Kight Toby | $156,000 | |
| Previous Owner | Mckelvey Douglas H | $277,380 |
Source: Public Records
Tax History Compared to Growth
Tax History
| Year | Tax Paid | Tax Assessment Tax Assessment Total Assessment is a certain percentage of the fair market value that is determined by local assessors to be the total taxable value of land and additions on the property. | Land | Improvement |
|---|---|---|---|---|
| 2025 | $4,286 | $212,224 | -- | -- |
| 2024 | $4,147 | $206,243 | -- | -- |
| 2023 | $4,147 | $200,236 | $0 | $0 |
| 2022 | $3,922 | $194,404 | $0 | $0 |
| 2021 | $3,968 | $354,986 | $33,000 | $321,986 |
| 2020 | $3,989 | $186,136 | $0 | $0 |
| 2019 | $5,171 | $181,951 | $0 | $0 |
| 2018 | $5,153 | $178,558 | $0 | $0 |
| 2017 | $5,086 | $174,885 | $0 | $0 |
| 2016 | $5,058 | $316,756 | $23,000 | $293,756 |
| 2015 | $5,140 | $253,480 | $27,500 | $225,980 |
| 2014 | -- | $313,917 | $22,200 | $291,717 |
| 2013 | -- | $242,121 | $23,900 | $218,221 |
Source: Public Records
Map
Nearby Homes
- 2111 SW 17th Place
- 1726 SW 21st St
- 1721 SW 21st Ln
- 2131 SW 17th Place
- 1708 SW 17th Ave
- 2106 SW 17th Ave
- 2139 SW 17th Place
- 1807 SW 21st Ln
- 1817 SW 21st Ln
- 2007 SW 15th Place
- 2013 SW 19th Place
- 1914 SW 15th Place
- 9 SW 22nd St
- 1817 SW 22nd Terrace
- 1601 SW 19th St
- 1826 SW 15th Place
- 2210 SW 19th Ave
- 2227 SW 15th Place
- 2247 SW 17th Place
- 1618 SW 23rd St
- 2018 SW 17th Ave
- 2010 SW 17th Ave
- 2006 SW 17th Ave
- 2019 SW 17th Place
- 2015 SW 17th Place
- 2015 SW 17th Place
- 2002 SW 17th Ave
- 2026 SW 17th Ave
- 2007 SW 17th Place
- 2103 SW 17th Place
- 1932 SW 17th Ave
- 2003 SW 17th Place
- 1721 SW 21st St
- 2107 SW 17th Place
- 2102 SW 17th Ave
- 1928 SW 17th Ave
- 1724 SW 20th Terrace
- 1931 SW 17th Place
- 1722 SW 21st St
- 2006 SW 17th Place