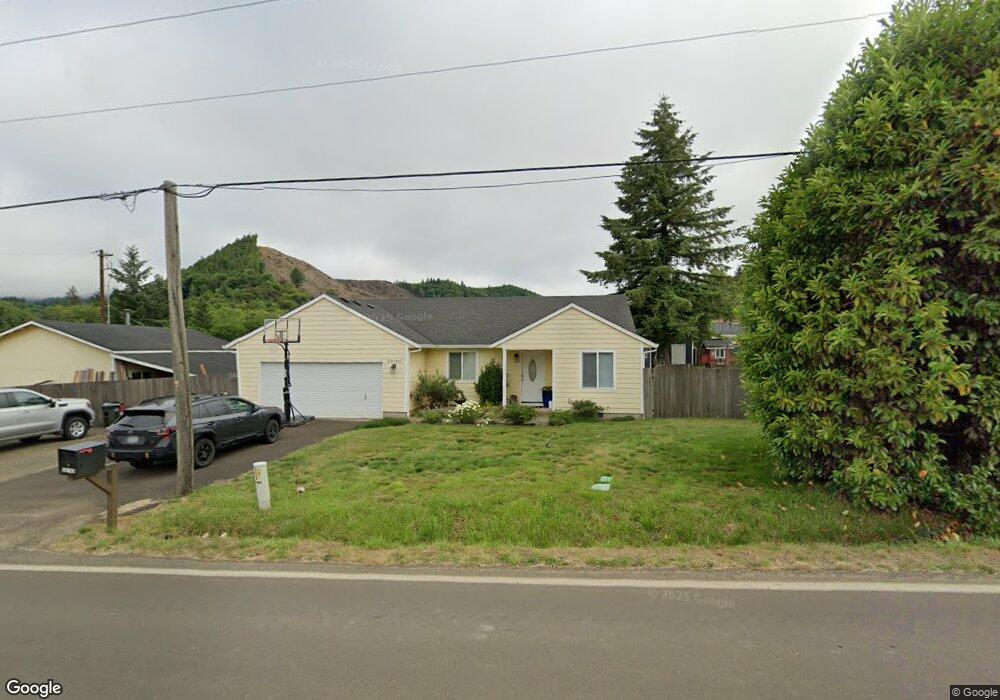
20140 Blaine Rd Beaver, OR 97108
Estimated Value: $395,222 - $474,000
3
Beds
2
Baths
1,235
Sq Ft
$346/Sq Ft
Est. Value
About This Home
This home is located at 20140 Blaine Rd, Beaver, OR 97108 and is currently estimated at $427,056, approximately $345 per square foot. 20140 Blaine Rd is a home located in Tillamook County with nearby schools including Nestucca K-8 School and Nestucca High School.
Ownership History
Date
Name
Owned For
Owner Type
Purchase Details
Closed on
Mar 22, 2018
Sold by
Morgan Stanley Abs Cap I Inc T
Bought by
Thiemens Jacob M
Current Estimated Value
Home Financials for this Owner
Home Financials are based on the most recent Mortgage that was taken out on this home.
Original Mortgage
$82,705
Outstanding Balance
$70,302
Interest Rate
4.32%
Mortgage Type
New Conventional
Estimated Equity
$356,754
Purchase Details
Closed on
Dec 1, 2017
Sold by
Wells Fargo Bank Na
Bought by
Thiemens Jacob M
Home Financials for this Owner
Home Financials are based on the most recent Mortgage that was taken out on this home.
Original Mortgage
$82,705
Interest Rate
4.32%
Mortgage Type
New Conventional
Purchase Details
Closed on
Sep 9, 2009
Sold by
Thiemens Jacob M
Bought by
Thiemens Jacob M and Thiemens Cassie R
Home Financials for this Owner
Home Financials are based on the most recent Mortgage that was taken out on this home.
Original Mortgage
$171,000
Interest Rate
5.2%
Mortgage Type
New Conventional
Purchase Details
Closed on
Sep 30, 2008
Sold by
Walker Janet C and Wyss Raymond C
Bought by
Reeder Perry C and Reeder Sharon L
Purchase Details
Closed on
Jun 1, 2005
Sold by
Rlc Inc
Bought by
Rlc Inc and High Heaven Investments Inc
Create a Home Valuation Report for This Property
The Home Valuation Report is an in-depth analysis detailing your home's value as well as a comparison with similar homes in the area
Purchase History
| Date | Buyer | Sale Price | Title Company |
|---|---|---|---|
| Thiemens Jacob M | $97,300 | None Listed On Document | |
| Thiemens Jacob M | $97,300 | Servicelink | |
| Thiemens Jacob M | -- | None Available | |
| Thiemens Jacob M | $180,000 | Ticor Title Insurance Co | |
| Reeder Perry C | $50,000 | Ticor Title | |
| Rlc Inc | -- | Ticor Title Ins Co |
Source: Public Records
Mortgage History
| Date | Status | Borrower | Loan Amount |
|---|---|---|---|
| Open | Thiemens Jacob M | $82,705 | |
| Previous Owner | Thiemens Jacob M | $82,705 | |
| Previous Owner | Thiemens Jacob M | $171,000 |
Source: Public Records
Tax History
| Year | Tax Paid | Tax Assessment Tax Assessment Total Assessment is a certain percentage of the fair market value that is determined by local assessors to be the total taxable value of land and additions on the property. | Land | Improvement |
|---|---|---|---|---|
| 2025 | $2,258 | $192,930 | $48,420 | $144,510 |
| 2024 | $2,135 | $187,320 | $47,010 | $140,310 |
| 2023 | $2,120 | $181,870 | $45,640 | $136,230 |
| 2022 | $2,042 | $176,580 | $44,320 | $132,260 |
| 2021 | $1,983 | $171,440 | $43,030 | $128,410 |
| 2020 | $1,935 | $166,450 | $41,780 | $124,670 |
| 2019 | $1,893 | $161,610 | $40,570 | $121,040 |
| 2018 | $1,737 | $156,910 | $39,390 | $117,520 |
| 2017 | $1,551 | $152,340 | $38,240 | $114,100 |
| 2016 | $1,507 | $147,910 | $37,120 | $110,790 |
| 2015 | $1,477 | $143,610 | $36,040 | $107,570 |
| 2014 | $1,442 | $139,430 | $34,990 | $104,440 |
| 2013 | -- | $135,370 | $33,970 | $101,400 |
Source: Public Records
Map
Nearby Homes
- 18999 Nestucca Dr
- 18485 Salmon Dr
- 0 Farmer Creek Rd Unit 1000 111923028
- 1000,1100 & 1200 Farmer Creek Rd
- 17805 Highway 101 S
- 16915 U S 101 S
- 31165 Oregon 22
- 31165 Highway 22
- 16915 Highway 101 S
- TL 500 Sandlake Rd
- TL 11200 Sandlake Rd
- 500 Sandlake Rd
- 0 Sandlake Rd Unit 25-541
- 0 Sandlake Rd Unit 1207
- 55 Meadow View
- Tax Lot # Rd
- 7715 Galloway Rd
- 701 U S 101 S
- TL#00200 U S 101 S
- TL #00701 U S 101 S
- 20120 Blaine Rd
- 20110 Blaine Rd
- 20150 Blaine Rd
- 20010 Blaine Rd
- 20150 Blaine Rd
- 20000 Blaine Rd
- TL1202 Blaine Rd
- 19990 Highway 101 S
- VL Blaine Rd
- 19960 Blaine Rd
- 3 Parcels US Coast 101 Hwy
- 24405 U S 101 S
- 24405 Hwy 101
- 24405 Highway 101 S
- 19940 Blaine Rd
- 24375 U S 101 S
- 101 Coast Hwy 101
- 24375 S Us-101
- 24355 Hwy 101 S
- 24375A U S 101
Your Personal Tour Guide
Ask me questions while you tour the home.