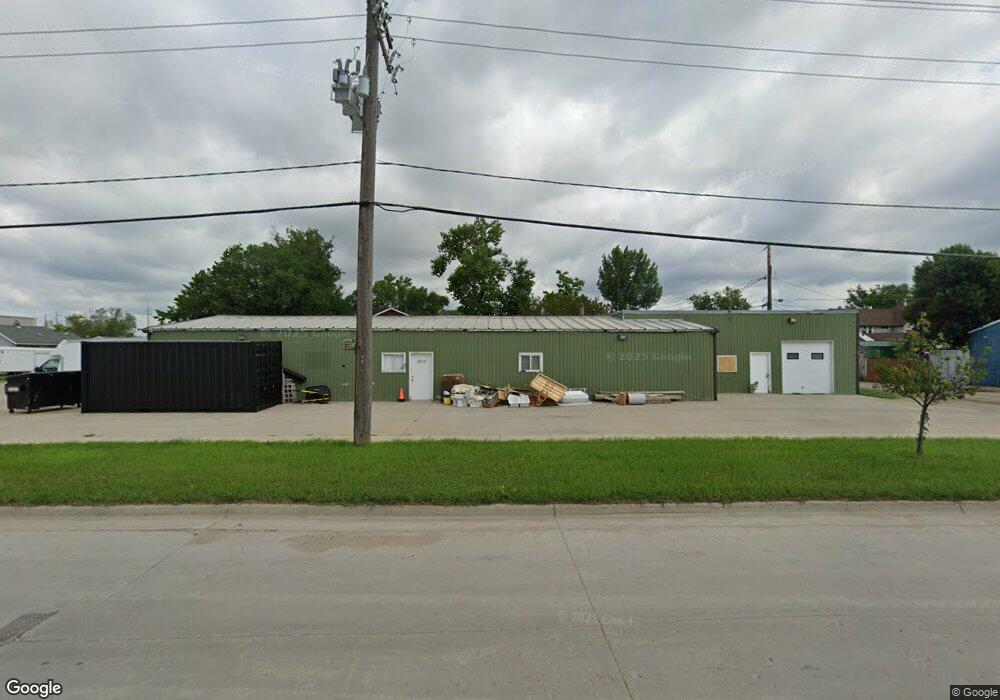
2015 3rd Ave N Fargo, ND 58102
Madison-Unicorn NeighborhoodEstimated Value: $273,230
--
Bed
2
Baths
3,600
Sq Ft
$76/Sq Ft
Est. Value
About This Home
This home is located at 2015 3rd Ave N, Fargo, ND 58102 and is currently estimated at $273,230, approximately $75 per square foot. 2015 3rd Ave N is a home located in Cass County with nearby schools including Madison Elementary School, Ben Franklin Middle School, and North High School.
Ownership History
Date
Name
Owned For
Owner Type
Purchase Details
Closed on
Jun 19, 2017
Sold by
Craig Holdings Llc
Bought by
Luebke Properties Llc
Current Estimated Value
Home Financials for this Owner
Home Financials are based on the most recent Mortgage that was taken out on this home.
Original Mortgage
$148,000
Interest Rate
4.02%
Mortgage Type
Commercial
Purchase Details
Closed on
Mar 21, 2017
Sold by
Mc Fargo Llc
Bought by
H & M Property Management Llc
Purchase Details
Closed on
Jan 6, 2016
Sold by
Kramer Terrence C and Kramer Patricia G
Bought by
Craig Holdings Llc
Home Financials for this Owner
Home Financials are based on the most recent Mortgage that was taken out on this home.
Original Mortgage
$113,600
Interest Rate
3.93%
Mortgage Type
Commercial
Create a Home Valuation Report for This Property
The Home Valuation Report is an in-depth analysis detailing your home's value as well as a comparison with similar homes in the area
Home Values in the Area
Average Home Value in this Area
Purchase History
| Date | Buyer | Sale Price | Title Company |
|---|---|---|---|
| Luebke Properties Llc | $185,000 | The Title Co | |
| H & M Property Management Llc | -- | None Available | |
| Craig Holdings Llc | $125,000 | Fargo Title Inc |
Source: Public Records
Mortgage History
| Date | Status | Borrower | Loan Amount |
|---|---|---|---|
| Closed | Luebke Properties Llc | $148,000 | |
| Previous Owner | Craig Holdings Llc | $113,600 |
Source: Public Records
Tax History Compared to Growth
Tax History
| Year | Tax Paid | Tax Assessment Tax Assessment Total Assessment is a certain percentage of the fair market value that is determined by local assessors to be the total taxable value of land and additions on the property. | Land | Improvement |
|---|---|---|---|---|
| 2024 | $4,950 | $134,400 | $13,500 | $120,900 |
| 2023 | $4,759 | $128,650 | $13,500 | $115,150 |
| 2022 | $4,258 | $110,900 | $13,500 | $97,400 |
| 2021 | $4,197 | $110,900 | $13,500 | $97,400 |
| 2020 | $3,806 | $99,000 | $13,500 | $85,500 |
| 2019 | $3,807 | $99,000 | $13,500 | $85,500 |
| 2018 | $2,590 | $58,150 | $8,500 | $49,650 |
| 2017 | $2,435 | $53,350 | $8,500 | $44,850 |
| 2016 | $1,480 | $53,350 | $8,500 | $44,850 |
| 2015 | $1,324 | $44,450 | $8,500 | $35,950 |
| 2014 | $1,190 | $38,650 | $8,500 | $30,150 |
| 2013 | $1,180 | $38,650 | $8,500 | $30,150 |
Source: Public Records
Map
Nearby Homes