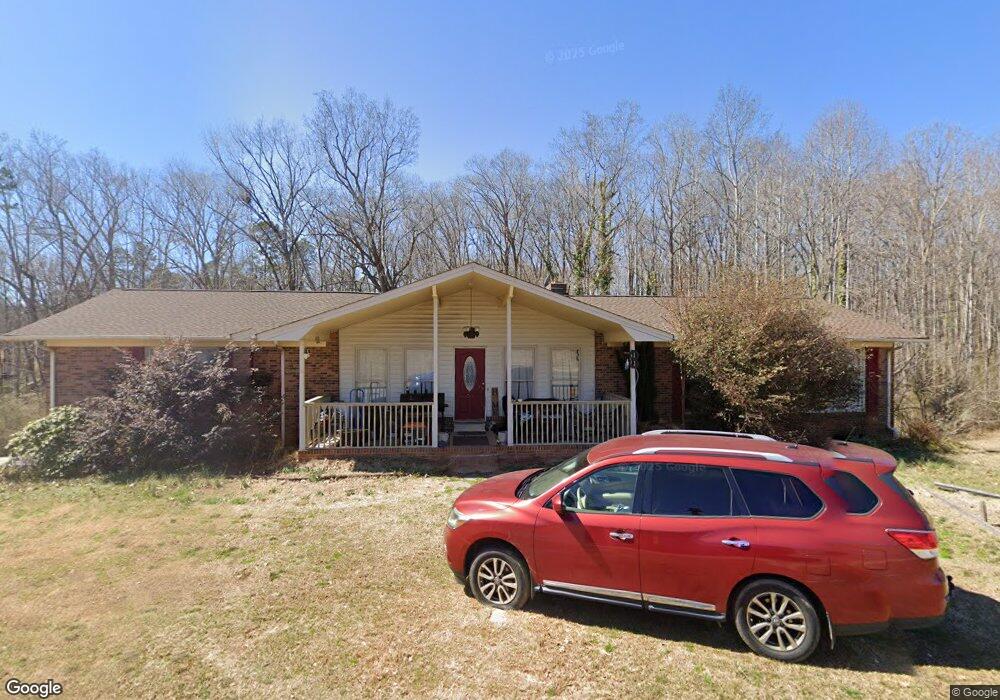
2015 Albert Blanton Rd Shelby, NC 28152
Estimated Value: $227,000 - $422,000
--
Bed
--
Bath
2,233
Sq Ft
$152/Sq Ft
Est. Value
About This Home
This home is located at 2015 Albert Blanton Rd, Shelby, NC 28152 and is currently estimated at $338,446, approximately $151 per square foot. 2015 Albert Blanton Rd is a home located in Cleveland County with nearby schools including Springmore Elementary School, Crest Middle School, and Crest High School.
Ownership History
Date
Name
Owned For
Owner Type
Purchase Details
Closed on
Feb 14, 2008
Sold by
U S Bank National Association
Bought by
Crotts Russell W and Crotts Elizabeth S
Current Estimated Value
Home Financials for this Owner
Home Financials are based on the most recent Mortgage that was taken out on this home.
Original Mortgage
$91,563
Outstanding Balance
$55,918
Interest Rate
5.46%
Mortgage Type
FHA
Estimated Equity
$282,528
Purchase Details
Closed on
Aug 14, 2007
Sold by
Harrris Phillip R and Harris Heather C
Bought by
U S Bank N A
Purchase Details
Closed on
Apr 21, 2006
Sold by
Ledbetter James Ralph and Ledbetter Lora M
Bought by
Harris Phillip R and Harris Heather C
Home Financials for this Owner
Home Financials are based on the most recent Mortgage that was taken out on this home.
Original Mortgage
$122,000
Interest Rate
7.5%
Mortgage Type
Adjustable Rate Mortgage/ARM
Create a Home Valuation Report for This Property
The Home Valuation Report is an in-depth analysis detailing your home's value as well as a comparison with similar homes in the area
Home Values in the Area
Average Home Value in this Area
Purchase History
| Date | Buyer | Sale Price | Title Company |
|---|---|---|---|
| Crotts Russell W | $88,000 | None Available | |
| U S Bank N A | $135,883 | None Available | |
| Harris Phillip R | $152,500 | None Available |
Source: Public Records
Mortgage History
| Date | Status | Borrower | Loan Amount |
|---|---|---|---|
| Open | Crotts Russell W | $91,563 | |
| Previous Owner | Harris Phillip R | $122,000 | |
| Previous Owner | Harris Phillip R | $36,500 |
Source: Public Records
Tax History Compared to Growth
Tax History
| Year | Tax Paid | Tax Assessment Tax Assessment Total Assessment is a certain percentage of the fair market value that is determined by local assessors to be the total taxable value of land and additions on the property. | Land | Improvement |
|---|---|---|---|---|
| 2025 | $1,637 | $257,829 | $49,698 | $208,131 |
| 2024 | $1,401 | $166,167 | $39,909 | $126,258 |
| 2023 | $1,399 | $166,167 | $39,909 | $126,258 |
| 2022 | $1,394 | $166,167 | $39,909 | $126,258 |
| 2021 | $1,399 | $166,167 | $39,909 | $126,258 |
| 2020 | $1,356 | $154,944 | $39,909 | $115,035 |
| 2019 | $1,356 | $154,944 | $39,909 | $115,035 |
| 2018 | $1,352 | $154,944 | $39,909 | $115,035 |
| 2017 | $1,345 | $154,944 | $39,909 | $115,035 |
| 2016 | $1,286 | $154,944 | $39,909 | $115,035 |
| 2015 | $1,337 | $161,358 | $39,909 | $121,449 |
| 2014 | $1,337 | $161,358 | $39,909 | $121,449 |
Source: Public Records
Map
Nearby Homes
- 1313 Dockery Dr Unit 1
- 1311 Dockery Dr
- 000 Hubbard Terrace
- 507 Poplar Springs Church Rd
- 00 Charles Rd
- 1408 Lackey St
- 3024 Downing St Unit 18A
- 3024 Downing St Unit 19A
- 712 Maynard St
- 3121 Suffolk Dr
- 814 Rhodann Dr
- 308 James Love School Rd
- 1303 Hunt St
- 2305 Berwick Rd
- 800 Charles Rd
- 697 Branton Dr
- 711 Cedar Hill Dr
- 602 Charles Rd
- 112 Holly Hill Rd
- 2924 Poplar Cir
- 2018 Albert Blanton Rd
- 2019 Albert Blanton Rd
- 1940 Wesson Rd
- 2024 Albert Blanton Rd
- 2024 Albert Blanton Rd
- 1939 Wesson Rd Unit 1
- 131 Alma Ln
- 137 Alma Ln
- 2100 Albert Blanton Rd
- 1906 Wesson Rd
- 2028 Wesson Rd
- 1900 Wesson Rd
- 2141 Albert Blanton Rd
- 611 Ronald Dr
- 1702 Wesson Rd
- 2122 Manley Bridges Rd
- 1700 Wesson Rd
- 1700 Wesson Rd
- 2036 Wesson Rd
- 1709 Wesson Rd