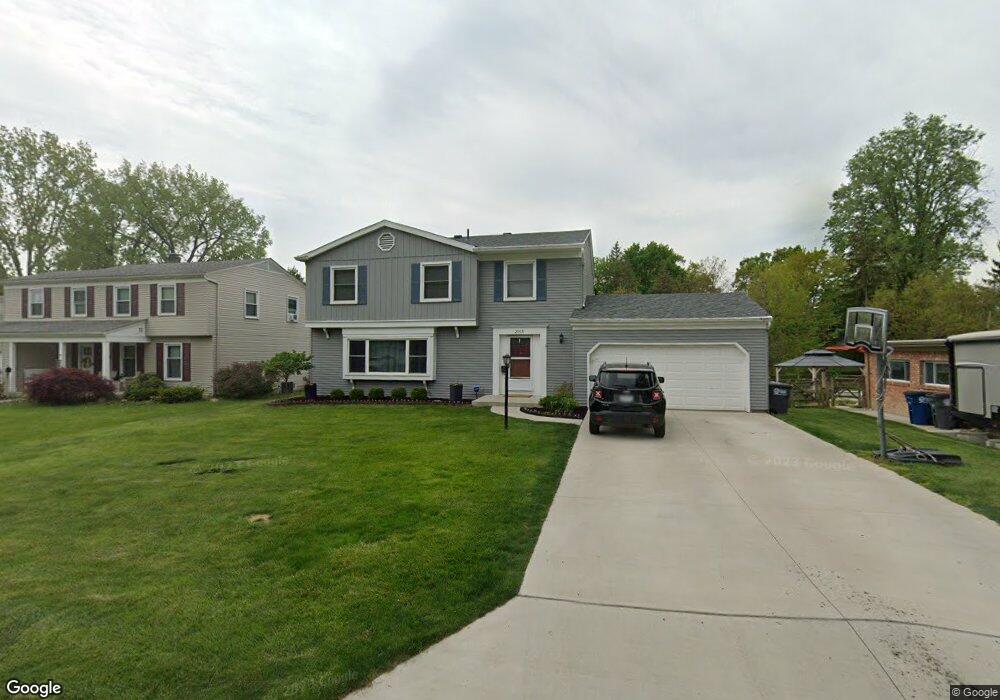
2015 Chalice Way Toledo, OH 43613
Whitmer-Trilby NeighborhoodEstimated Value: $242,691 - $278,000
5
Beds
3
Baths
2,026
Sq Ft
$125/Sq Ft
Est. Value
About This Home
This home is located at 2015 Chalice Way, Toledo, OH 43613 and is currently estimated at $254,173, approximately $125 per square foot. 2015 Chalice Way is a home located in Lucas County with nearby schools including Washington Junior High School, Jefferson Junior High School, and Whitmer High School.
Ownership History
Date
Name
Owned For
Owner Type
Purchase Details
Closed on
Nov 8, 2022
Sold by
Patrick Alan Measles Trust and Wendy Sue Measles Trust
Bought by
Measles Patrick Alan
Current Estimated Value
Purchase Details
Closed on
Dec 8, 2015
Sold by
Measles Patrick Alan and Measles Wendy Sue
Bought by
Measles Patrick Alan and Patrick Alan Measles Trust
Purchase Details
Closed on
Sep 21, 2010
Sold by
Measle Amy L
Bought by
Measles Patrick A
Purchase Details
Closed on
Oct 5, 2001
Sold by
Marikay Blankenship
Bought by
Measles Patrick A and Measles Amy L
Home Financials for this Owner
Home Financials are based on the most recent Mortgage that was taken out on this home.
Original Mortgage
$154,850
Interest Rate
6.99%
Purchase Details
Closed on
Jan 29, 1998
Sold by
Blankenship Edwin T and Blakenship Mary K
Bought by
Blankenship Marikay
Create a Home Valuation Report for This Property
The Home Valuation Report is an in-depth analysis detailing your home's value as well as a comparison with similar homes in the area
Home Values in the Area
Average Home Value in this Area
Purchase History
| Date | Buyer | Sale Price | Title Company |
|---|---|---|---|
| Measles Patrick Alan | -- | None Listed On Document | |
| Measles Patrick Alan | -- | None Available | |
| Measles Patrick A | -- | Attorney | |
| Measles Patrick A | $163,000 | Northwest Title Agency Of Oh | |
| Blankenship Marikay | -- | -- |
Source: Public Records
Mortgage History
| Date | Status | Borrower | Loan Amount |
|---|---|---|---|
| Previous Owner | Measles Patrick A | $154,850 |
Source: Public Records
Tax History Compared to Growth
Tax History
| Year | Tax Paid | Tax Assessment Tax Assessment Total Assessment is a certain percentage of the fair market value that is determined by local assessors to be the total taxable value of land and additions on the property. | Land | Improvement |
|---|---|---|---|---|
| 2024 | $1,980 | $64,925 | $8,820 | $56,105 |
| 2023 | $3,878 | $54,390 | $7,455 | $46,935 |
| 2022 | $3,869 | $54,390 | $7,455 | $46,935 |
| 2021 | $4,025 | $54,390 | $7,455 | $46,935 |
| 2020 | $4,176 | $48,720 | $7,385 | $41,335 |
| 2019 | $4,054 | $48,720 | $7,385 | $41,335 |
| 2018 | $3,730 | $48,720 | $7,385 | $41,335 |
| 2017 | $3,866 | $47,600 | $7,210 | $40,390 |
| 2016 | $3,761 | $136,000 | $20,600 | $115,400 |
| 2015 | $3,747 | $136,000 | $20,600 | $115,400 |
| 2014 | $3,243 | $47,600 | $7,210 | $40,390 |
| 2013 | $3,243 | $47,600 | $7,210 | $40,390 |
Source: Public Records
Map
Nearby Homes
- 5327 Oldham Dr
- 1850 W Alexis Rd
- 5750 Winona Dr
- 2329 Ida Dr
- 2315 Ann Dr
- 2336 Murray Dr
- 1826 Newport Ave
- 1715 E Benwick Rd
- 5917 Tetherwood Dr Unit 5917
- 1708 E Glastonberry Rd
- 2424 Bodette Ave
- 1760 Ketner Ave
- 1760 Primrose Ave
- 5530 Douglas Rd
- 5470 Douglas Rd
- 1730 Ketner Ave
- 5154 Valley Forge Dr
- 5951 Livingston Dr
- 5840 Douglas Rd
- 2341 Wernert Ave
- 2007 Chalice Way
- 2023 Chalice Way
- 5541 Towne Ct
- 2001 Chalice Way
- 2029 Chalice Way
- 5540 Towne Ct
- 2016 Chalice Way
- 1979 Chalice Way
- 2010 Chalice Way
- 2024 Chalice Way
- 5537 Towne Ct
- 2035 Chalice Way
- 2002 Chalice Way
- 5534 Towne Ct
- 2030 Chalice Way
- 1971 Chalice Way
- 5602 E Rowland Rd
- 1982 Chalice Way
- 5550 E Rowland Rd
- 5528 Bucklew Ct